
Fig. 1
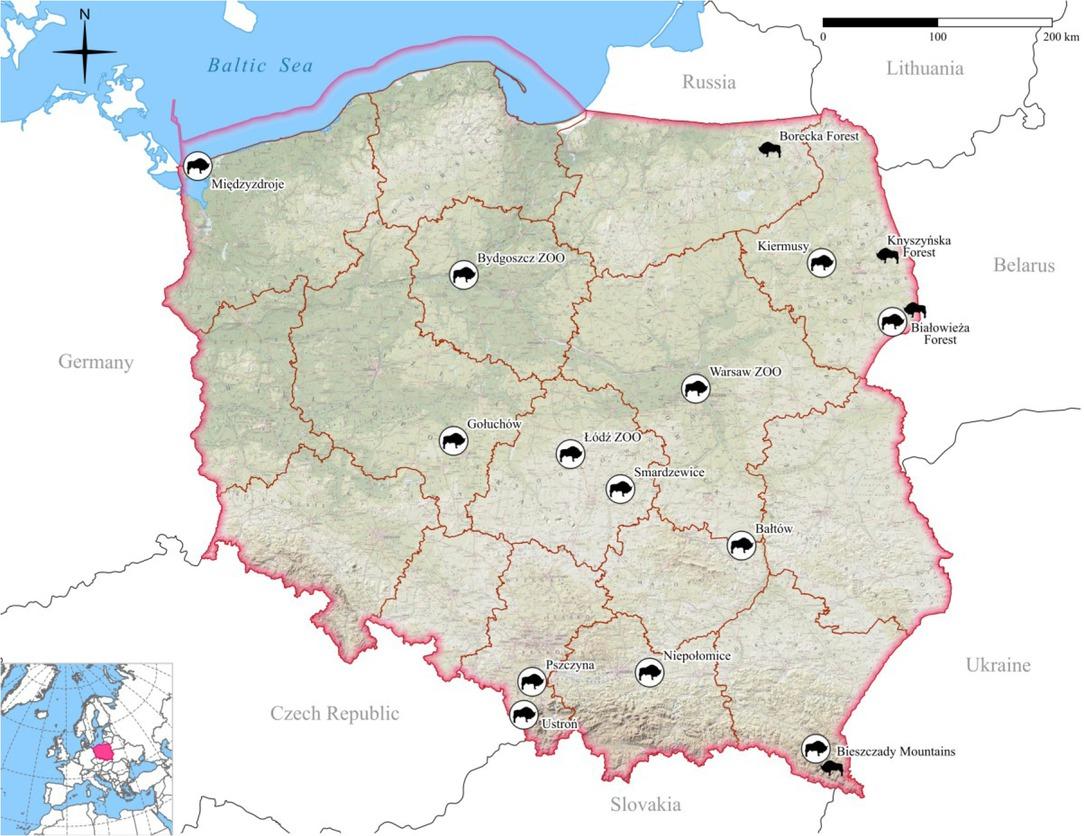
Fig. 2
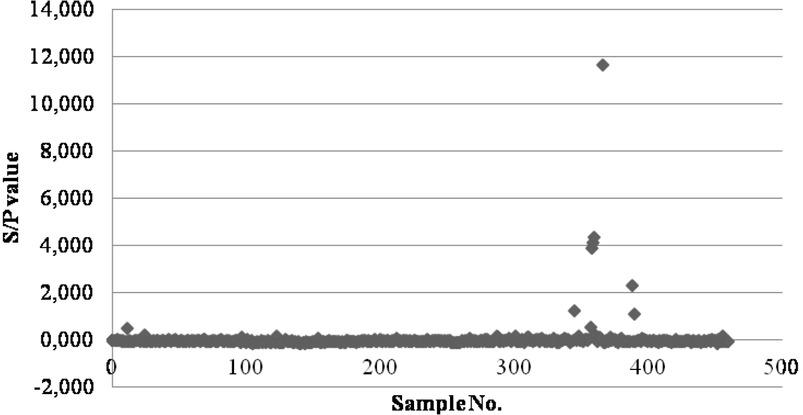
Fig. 3
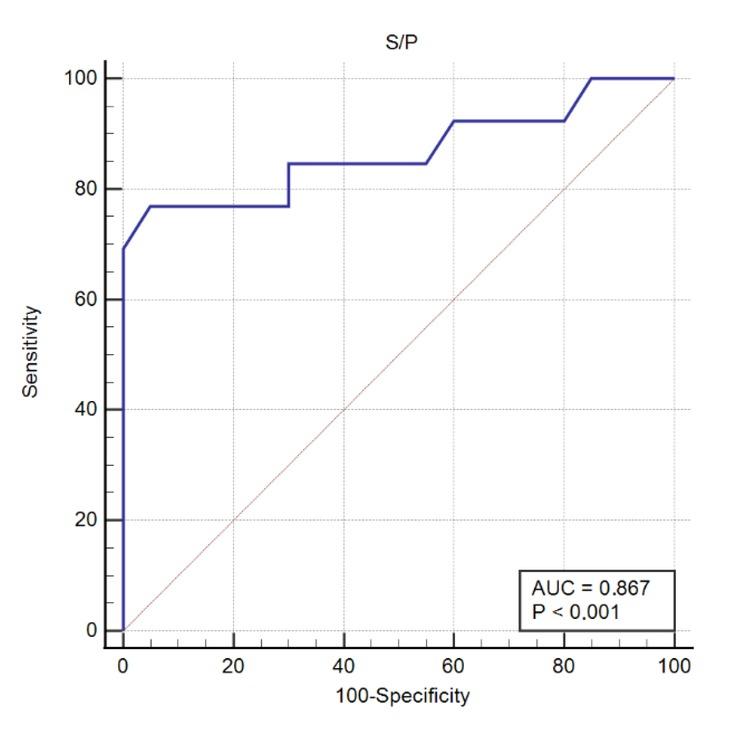
Comparison of an antibody ELISA and tuberculin skin test (TST), interferon gamma release assay (IGRA), and TST and IGRA combined in identification of tuberculosis-affected European bison
| Antibody ELISA versus | TST (na = 25; 4/21b) | IGRA (n = 31; 9/22b) | TST+IGRA (na = 33; 13/20b) |
|---|---|---|---|
| Positive/negative results | |||
| Sensitivity (%) | 50.00 | 22.22 | 38.46 |
| 95% CIc | 6.16–93.24 | 2.81–60.01 | 13.86–68.42 |
| Specificity (%) | 95.24 | 90.91 | 100 |
| 95% CI | 76.18–99.88 | 70.84–98.88 | 83.16–100 |
| Positive predictive value (%) | 9.59 | 2.41 | 100 |
| 95% CI | 1.22–47.64 | 0.41–12.10 | − |
| Negative predictive value (%) | 99.47 | 99.14 | 99.38 |
| 95% CI | 98.60–99.80 | 98.76–99.41 | 99.05–99.60 |
| Accuracy | 94.76 | 90.22 | 99.38 |
| 95% CI | 77.86–99.72 | 74.12–97.91 | 88.27–100 |
| Kappa | 0.503 | 0.157 | 0.431 |
| 95% CI | 0.019–0.987 | −0.191–0.506 | 0.148–0.713 |
| S/P values | |||
| Area under ROC curve | 0.619 | 0.848 | 0.867 |
| Standard errord | 0.205 | 0.077 | 0.0773 |
| 95% CI | 0.405–0.804 | 0.674–0.951 | 0.704–0.960 |
| Significance level P | 0.562 | <0.0001 | <0.0001 |
| Youden’s J statisticse | 0.452 | 0.641 | 0.719 |
| Optimum cut-off point | >0.002 | >−0.02 | >−0.016 |
| Sensitivity | 50.00 | 77.78 | 76.92 |
| Specificity | 95.24 | 86.36 | 95.00 |
Descriptive statistics of 436 European bison tested for the presence of Mycobacterium bovis antibodies with respect to the year of sampling, origin, population type, sanitary status, sex and age group_ Statistically significant differences were determined using Pearson’s χ2 test_ A P value of ≤0_05 was considered significant
| Variable | ||||||
|---|---|---|---|---|---|---|
| n/Na | % | 95% CIb | χ2 | P | ||
| Year | 9.50 | 0.22 | ||||
| 2013 | 1/13 | 7.7 | 0.2–36.0 | |||
| 2014 | 0/47 | 0 | 0–7.5c | |||
| 2015 | 0/63 | 0 | 0–5.7 | |||
| 2016 | 0/43 | 0 | 0–8.2 | |||
| 2017 | 1/81 | 1.2 | 0.03–6.7 | |||
| 2018 | 1/111 | 0.9 | 0.02–4.9 | |||
| 2019 | 2/60 | 3.33 | 0.4–11.5 | |||
| 2020 | 0/18 | 0 | 0–18.5 | |||
| Origin | 18.08 | 0.26 | ||||
| Bałtów | 0/7 | 0 | 0–41.0 | |||
| Białowieża Forest | 3/173 | 1.7 | 0.4–5.0 | |||
| Bieszczady Mountains | 0/38 | 0 | 0–9.2 | |||
| Gołuchów | 0/11 | 0 | 0–28.5 | |||
| Kiermusy | 0/5 | 0 | 0–52.2 | |||
| Międzyzdroje | 0/5 | 0 | 0–52.2 | |||
| Niepołomice | 0/22 | 0 | 0–15.4 | |||
| Pszczyna | 0/45 | 0 | 0–7.9 | |||
| Borecka Forest | 1/42 | 2.3 | 0.06–12.6 | |||
| Knyszyńska Forest | 0/62 | 0 | 0–5.8 | |||
| Smardzewice | 1/14 | 7.1 | 0.2–33.9 | |||
| Ustroń | 0/2 | 0 | 0–84.2 | |||
| Bydgoszcz Zoo | 0/1 | 0 | 0–97.5 | |||
| Łódź Zoo | 0/3 | 0 | 0–70.7 | |||
| Warsaw Zoo | 0/6 | 0 | 0–45.9 | |||
| Population type | 0.11 | 0.736 | ||||
| free-ranging | 2/207 | 0.9 | 0.1–3.4 | |||
| captive | 3/229 | 1.3 | 0.3–3.7 | |||
| Sanitary status | 0.45 | 0.93 | ||||
| potentially healthy (immobilised) | 3/269 | 1.1 | 0.1–3.2 | |||
| eliminated | 2/138 | 1.4 | 0.2–5.1 | |||
| fallen | 0/20 | 0 | 0–16.8 | |||
| killed in accidents | 0/9 | 0 | 0–33.6 | |||
| Sex | 0.49 | 0.48 | ||||
| XX | 2/242 | 0.8 | 0.1–2.9 | |||
| XY | 3/194 | 1.5 | 0.3–4.4 | |||
| Age group | 3.18 | 0.20 | ||||
| calves (≤1 year) | 1/66 | 1.5 | 0.03–8.1 | |||
| juveniles (2–3 years) | 0/161 | 0 | 0–2.2 | |||
| adults (≥4 years) | 4/199 | 2.0 | 0.5–5.1 | |||
| no data | 0/10 | 0 | 0–30.8 | |||
List of Mycobacterium bovis ELISA-positive samples among 436 serum samples collected from European bison from 15 different Polish populations
| No. | Year of sampling | Date of sampling (dd/mm) | Animal | Year of birth | Age | Sex | Sanitary status | Origin | Population type | S/P value |
|---|---|---|---|---|---|---|---|---|---|---|
| 1 | 2019 | 21/02 | B | 2018 | 7 mo | XY | culled | Białowieża Forest | free-ranging | 2.311 |
| 2 | 2013 | 21/11 | A | 2001 | 12 yrs | XY | immobilised | Białowieża Forest | captive | 0.477 |
| 3 | 2018 | 24/10 | E | 2013 | 5 yrs | XX | immobilised | Białowieża Forest | captive | 0.530 |
| 4 | 2019 | 23/02 | C | 2012 | 7 yrs | XY | immobilised | Borecka Forest | free-ranging | 1.068 |
| 5 | 2018 | 11/12 | D | 2008 | 10 yrs | XX | culled | Smardzewice | captive | 11.671 |
| 6 | 2016 | 01/02 | D | 2008 | 8 yrs | XX | immobilised | Smardzewice | captive | 1.240 |
| 7 | 2016 | 14/11 | D | 2008 | 8 yrs | XX | immobilised | Smardzewice | captive | 3.891 |
| 8 | 2017 | 18/09 | D | 2008 | 9 yrs | XX | immobilised | Smardzewice | captive | 4.137 |
| 9 | 2018 | 22/05 | D | 2008 | 10 yrs | XX | immobilised | Smardzewice | captive | 4.365 |
Detailed sensitivity and specificity for each cut-off value of M_ bovis antibody ELISA against a combined tuberculin skin test and interferon -gamma release assay (TST+IGRA)
| Cut-off | Sensitivity (%) | Specificity (%) | Correctly classified (%) | LR+ | LR− |
|---|---|---|---|---|---|
| ≥0.124 | 100.00 | 0.00 | 39.39 | 1.0000 | |
| ≥0.120 | 100.00 | 5.00 | 42.42 | 1.0526 | 0.0000 |
| ≥0.111 | 100.00 | 10.00 | 45.45 | 1.1111 | 0.0000 |
| ≥0.103 | 100.00 | 15.00 | 48.48 | 1.1765 | 0.0000 |
| ≥0.080 | 92.31 | 20.00 | 48.48 | 1.1538 | 0.3846 |
| ≥0.079 | 92.31 | 30.00 | 54.55 | 1.3187 | 0.2564 |
| ≥0.075 | 92.31 | 40.00 | 60.61 | 1.5385 | 0.1923 |
| ≥0.075 | 84.62 | 40.00 | 57.58 | 1.4103 | 0.3846 |
| ≥0.074 | 84.62 | 45.00 | 60.61 | 1.5385 | 0.3419 |
| ≥0.068 | 84.62 | 50.00 | 63.64 | 1.6923 | 0.3077 |
| ≥0.066 | 84.62 | 55.00 | 66.67 | 1.8803 | 0.2797 |
| ≥0.060 | 84.62 | 60.00 | 69.70 | 2.1154 | 0.2564 |
| ≥0.050 | 84.62 | 65.00 | 72.73 | 2.4176 | 0.2367 |
| ≥0.039 | 84.62 | 70.00 | 75.76 | 2.8205 | 0.2198 |
| ≥0.033 | 76.92 | 70.00 | 72.73 | 2.5641 | 0.3297 |
| ≥0.030 | 76.92 | 75.00 | 75.76 | 3.0769 | 0.3077 |
| ≥0.027 | 76.92 | 80.00 | 78.79 | 3.8462 | 0.2885 |
| ≥0.019 | 76.92 | 85.00 | 81.82 | 5.1282 | 0.2715 |
| ≥0.016 | 76.92 | 90.00 | 84.85 | 7.6923 | 0.2564 |
| ≥0.012 | 76.92 | 95.00 | 87.88 | 15.3846 | 0.2429 |
| ≥0.012 | 69.23 | 95.00 | 84.85 | 13.8462 | 0.3239 |
| ≥0.002 | 69.23 | 100.00 | 87.88 | 0.3077 | |
| ≥0.099 | 61.54 | 100.00 | 84.85 | 0.3846 | |
| ≥0.125 | 53.85 | 100.00 | 81.82 | 0.4615 | |
| ≥0.165 | 46.15 | 100.00 | 78.79 | 0.5385 | |
| ≥1.240 | 38.46 | 100.00 | 75.76 | 0.6154 | |
| ≥3.890 | 30.77 | 100.00 | 72.73 | 0.6923 | |
| ≥4.137 | 23.08 | 100.00 | 69.70 | 0.7692 | |
| ≥4.364 | 15.38 | 100.00 | 66.67 | 0.8462 | |
| ≥11.670 >11.670 | 7.69 0.00 | 100.00 100.00 | 63.64 60.61 | 0.9231 1.0000 |