
Table 1
The percentage of peripheral blood lymphocyte subpopulations of bovine leukaemia virus–infected cattle in the aleukaemic (AL) and persistently lymphocytotic (PL) stages
| Cow sample | ELISA | PCR | Phase of infection | Lymphocytes/mm3 | CD19+ | CD19+ IgM+ | CD4+ | CD8+ |
|---|---|---|---|---|---|---|---|---|
| 1 | + | + | AL | 7,600 | 25 | 46 | 25 | 3 |
| 2 | + | + | 7,800 | 67 | 75 | 15 | 17 | |
| 3 | + | + | 8,400 | 54 | 80 | 27 | 23 | |
| 4 | + | + | 8,800 | 45 | 27 | 31 | 10 | |
| 5 | + | + | 9,000 | 54 | 45 | 26 | 32 | |
| 6 | + | + | 9,600 | 54 | 61 | 23 | 27 | |
| 7 | + | + | 9,600 | 67 | 64 | 33 | 20 | |
| 8 | + | + | 10,200 | 47 | 18 | 30 | 6 | |
| 9 | + | + | 10,300 | 82 | 68 | 1 | 2 | |
| 10 | + | + | 10,400 | 96 | 20 | 2 | 2 | |
| 11 | + | + | 11,200 | 51 | 19 | 30 | 4 | |
| Mean value | 9,354 | 58.3 | 47.5 | 22.1 | 13.5 | |||
| 1 | + | + | PL | 12,800 | 66 | 65 | 21 | 4 |
| 2 | + | + | 15,200 | 55 | 77 | 27 | 31 | |
| 3 | + | + | 15,600 | 39 | 62 | 13 | 5 | |
| 4 | + | + | 26,000 | 83 | 81 | 6 | 2 | |
| 5 | + | + | 26,400 | 61 | 81 | 5 | 2 | |
| 6 | + | + | 39,000 | 96 | 61 | 8 | 2 | |
| 7 | + | + | 39,000 | 73 | 36 | 7 | 2 | |
| 8 | + | + | 63,200 | 96 | 86 | 4 | 4 | |
| Mean value | 29,650 | 71.1 | 68.6 | 11.4 | 6.5 |
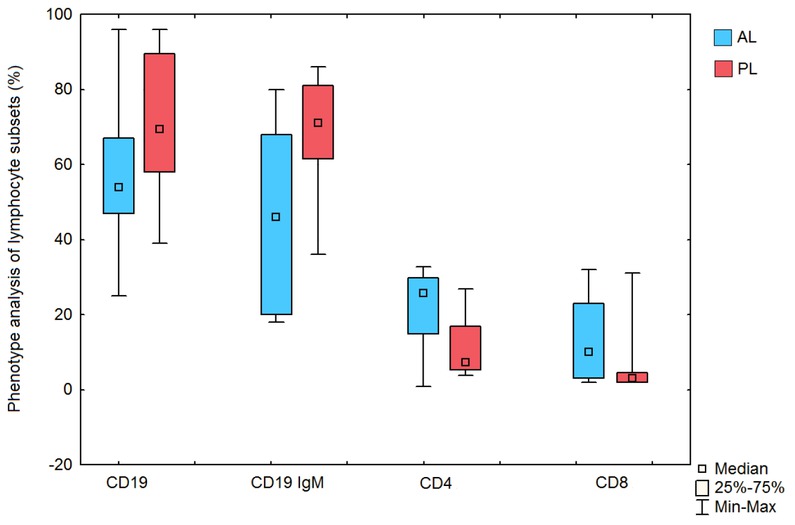
Fig. 1
The difference in the percentages of cluster of differentiation CD19+ and CD19+ immunoglobulin M+ B and CD4+ and CD8+ T lymphocyte subpopulations depending on bovine leukaemia virus infection stage
AL – aleukaemic stage of infection; PL – persistently lymphocytotic stage of infection. Median values were used to provide a better measure of the central tendency
Table 2
The expression of gp51 in blood lymphocyte subsets of bovine leukaemia virus infected cattle (%)
| CD19+ | CD19+ IgM+ | CD4+ | CD8+ | ||||
|---|---|---|---|---|---|---|---|
| 1 | AL | 7,600 | 15 | 20 | 0 | 16 | 51 |
| 2 | 7,800 | 25 | 7 | 1 | 7 | 40 | |
| 3 | 8,400 | 29 | 20 | 0 | 10 | 59 | |
| 4 | 8,800 | 38 | 12 | 2 | 10 | 62 | |
| 5 | 9,000 | 30 | 18 | 3 | 21 | 72 | |
| 6 | 9,600 | 38 | 13 | 0 | 17 | 68 | |
| 7 | 9,600 | 1 | 3 | 0 | 2 | 6 | |
| 8 | 10,200 | 24 | 10 | 0 | 1 | 35 | |
| 9 | 10,300 | 3 | 3 | 0 | 0 | 6 | |
| 10 | 10,400 | 28 | 19 | 3 | 12 | 62 | |
| 11 | 11,200 | 1 | 1 | 0 | 0 | 2 | |
| Mean value | 9,354 | 21.0 | 11.4 | 0.8 | 8.7 | 41.3 | |
| 1 | PL | 12,800 | 16 | 10 | 1 | 4 | 31 |
| 2 | 15,200 | 21 | 24 | 0 | 17 | 62 | |
| 3 | 15,600 | 19 | 30 | 0 | 5 | 54 | |
| 4 | 26,000 | 31 | 9 | 0 | 2 | 42 | |
| 5 | 26,400 | 9 | 8 | 1 | 5 | 23 | |
| 6 | 39,000 | 34 | 23 | 2 | 2 | 61 | |
| 7 | 39,000 | 28 | 18 | 0 | 2 | 58 | |
| 8 | 63,200 | 68 | 20 | 1 | 4 | 93 | |
| Mean value | 29,650 | 28.25 | 17.7 | 0.6 | 5.2 | 53.0 |
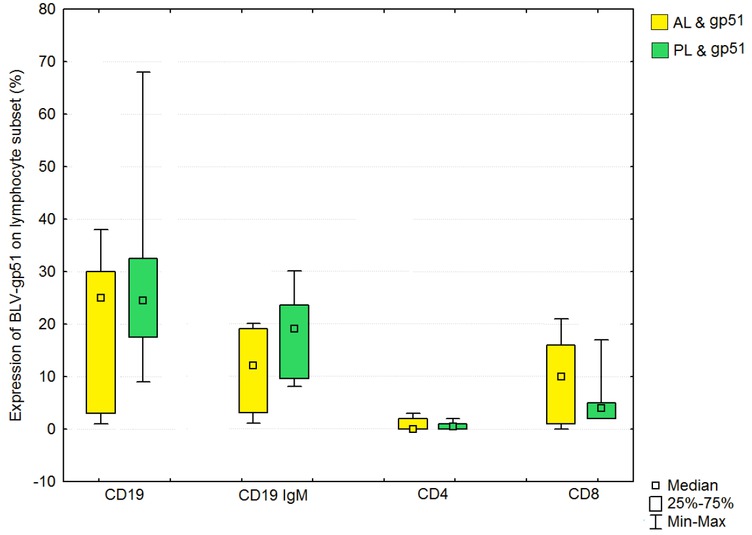
Fig. 2
The effect of BLV gp51 antigen expression in the of cluster of differentiation CD19+ and CD19+ immunoglobulin M (IgM)+ B and CD4+ and CD8+ T lymphocyte subpopulations
AL – aleukaemic stage of infection; PL – persistently lymphocytotic stage of infection
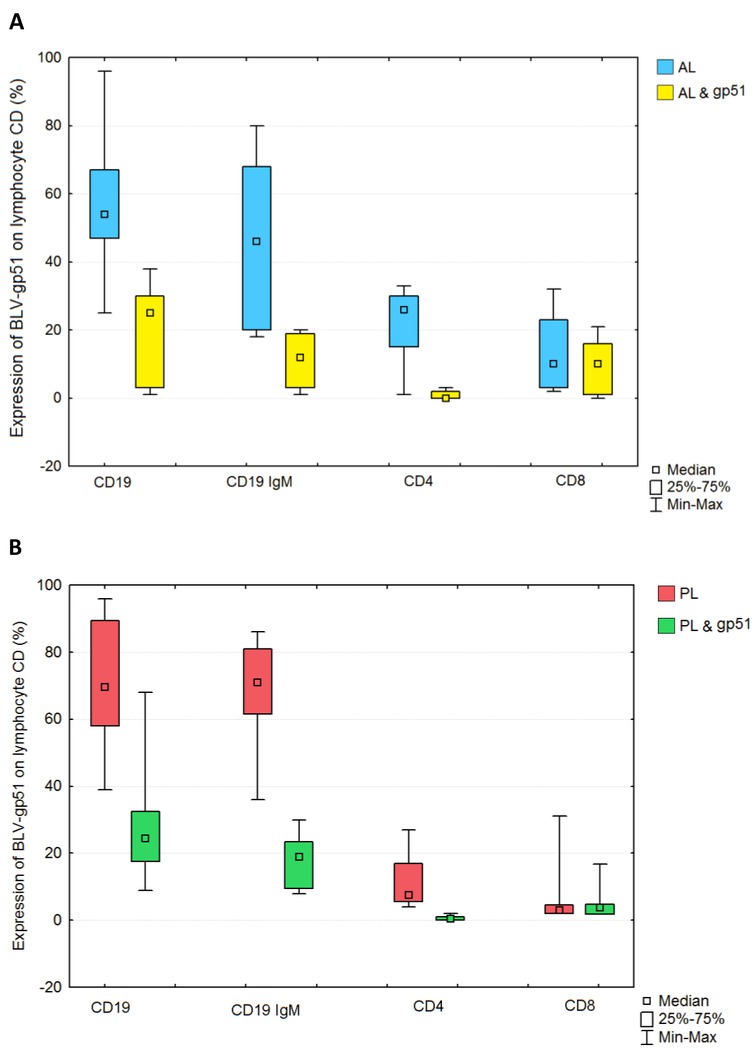
Fig. 3
The effect of BLV gp51 antigen expression in the number of cluster of differentiation CD19+ and CD19+ immunoglobulin M (IgM)+ B and CD4+ and CD8+ T lymphocyte subpopulations
AL – aleukaemic stage of infection; PL – persistently lymphocytotic stage of infection
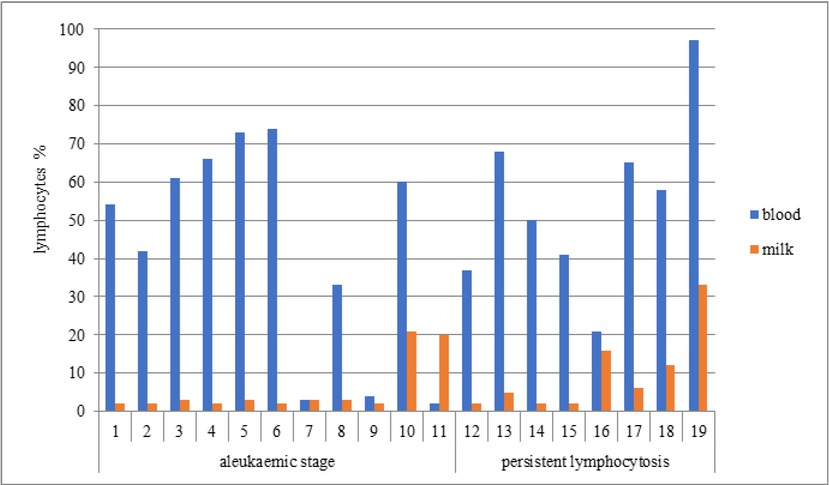
Fig. 4
The expression of glycoprotein 51 in blood and milk lymphocytes of bovine leukaemia virus-infected cows with clearly much higher expression in blood lymphocytes than in milk cells
Table 3
The expression of gp51 in milk lymphocyte subsets of bovine leukaemia virus–infected cows (%)
| ELISA | PCR | CD19+ | CD4+ | CD8+ | CD19+ IgM+ | ||||
|---|---|---|---|---|---|---|---|---|---|
| 1 | AL | 7,600 | + | + | 1 | − | − | 1 | 2 |
| 2 | 7,800 | + | + | 2 | − | − | − | 2 | |
| 3 | 8,400 | + | + | − | − | − | 3 | 3 | |
| 4 | 8,800 | + | + | − | − | − | 2 | 2 | |
| 5 | 9,000 | + | + | 2 | − | 1 | − | 3 | |
| 6 | 9,600 | + | + | 1 | − | 1 | − | 2 | |
| 7 | 9,600 | + | + | 1 | − | − | 3 | 4 | |
| 8 | 10,200 | + | + | 1 | − | 1 | 1 | 3 | |
| 9 | 10,300 | + | + | 3 | − | − | − | 3 | |
| 10 | 10,400 | + | + | 18 | − | − | 4 | 21 | |
| 11 | 11,200 | + | + | 10 | − | − | 6 | 20 | |
| Mean value | 9,354 | + | + | 3.5 | - | 0.3 | 1.8 | 5.7 | |
| 1 | PL | 12,800 | + | + | 1 | − | − | 1 | 2 |
| 2 | 15,200 | + | + | 3 | − | − | 2 | 5 | |
| 3 | 15,600 | + | + | 1 | − | − | 2 | 3 | |
| 4 | 26,000 | + | + | 2 | − | 1 | − | 3 | |
| 5 | 26,400 | + | + | 9 | 1 | 2 | 3 | 15 | |
| 6 | 39,000 | + | + | 4 | − | − | 3 | 7 | |
| 7 | 39,000 | + | + | 10 | − | 1 | 2 | 13 | |
| 8 | 63,200 | + | + | 21 | − | 4 | 9 | 33 | |
| Mean value | 29,650 | 6.3 | 0.1 | 1.0 | 2.7 | 10.2 |
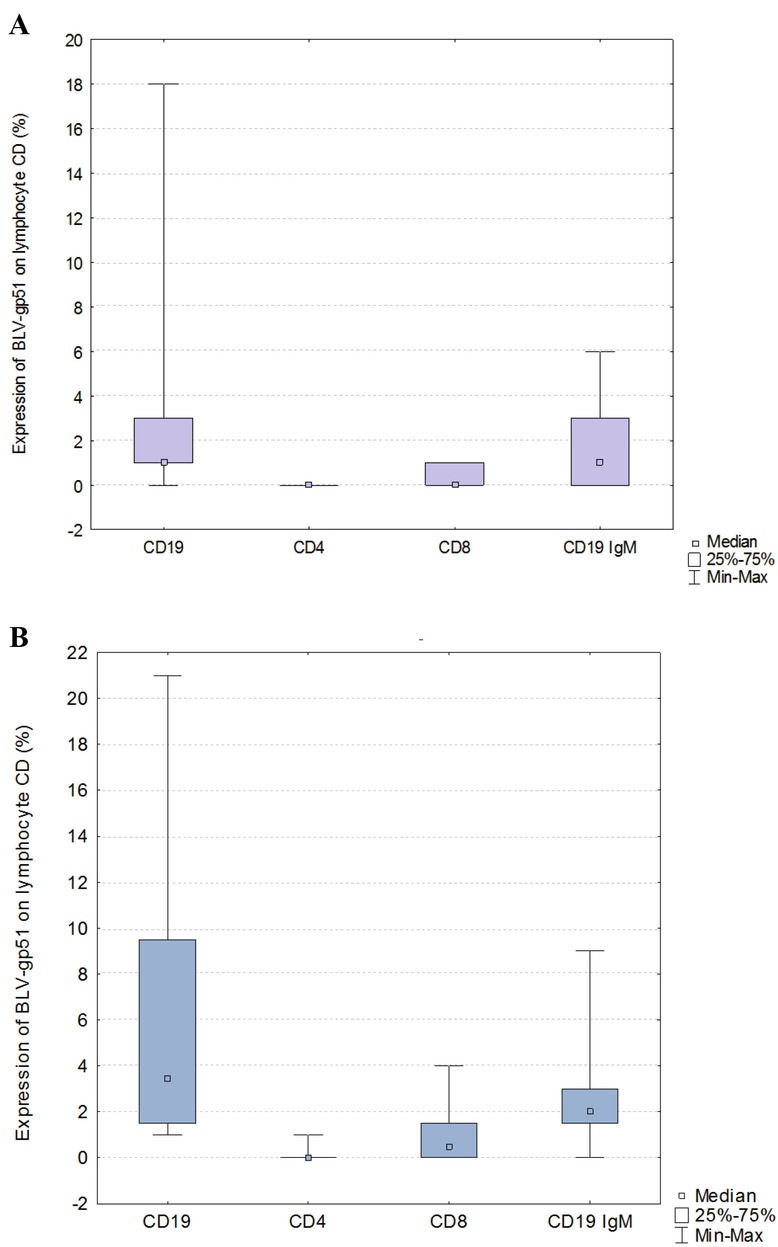
Fig. 5
The expression of BLV glycoprotein (gp) 51 antigen in milk: in cluster of differentiation CD19+, CD19+ immunoglobulin M (IgM)+ B and CD4+, CD8+ T lymphocyte subpopulations
A – AL stage of infection; B – PL stage of infection
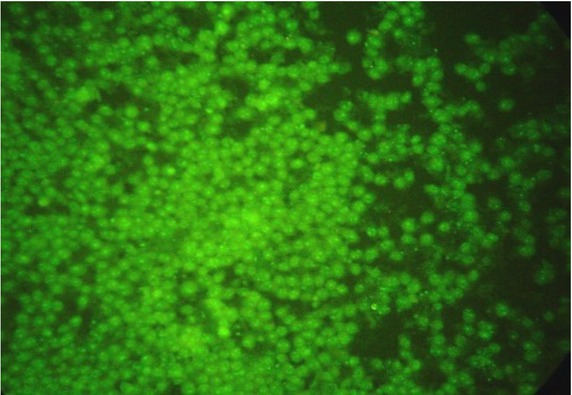
Fig. 6
Immunofluorescence showing the expression of bovine leukaemia virus glycoprotein 51 in blood lymphocytes of a cow with persistent lymphocytosis
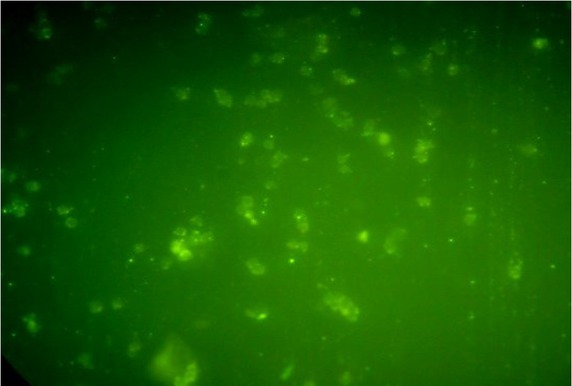
Fig. 7
Immunofluorescence showing the expression of bovine leukaemia virus glycoprotein51 in cells from a milk sample from a leukaemic cow