
Fig. 1
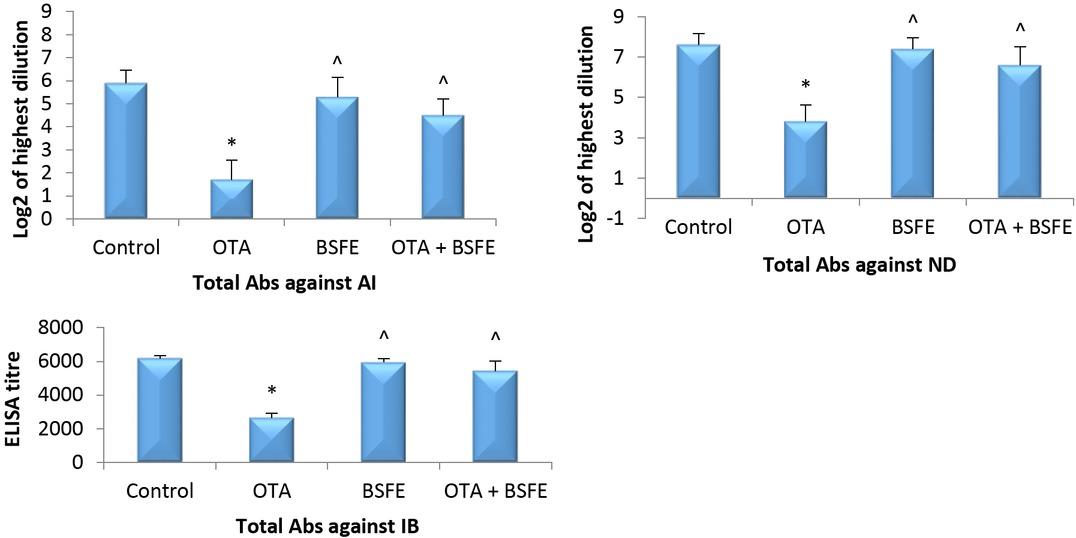
Fig. 2
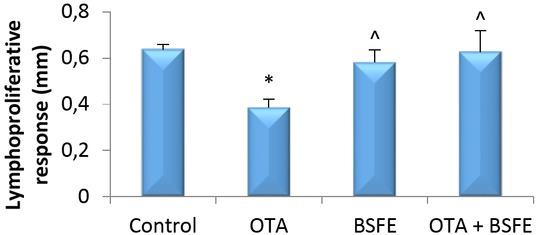
Fig. 3
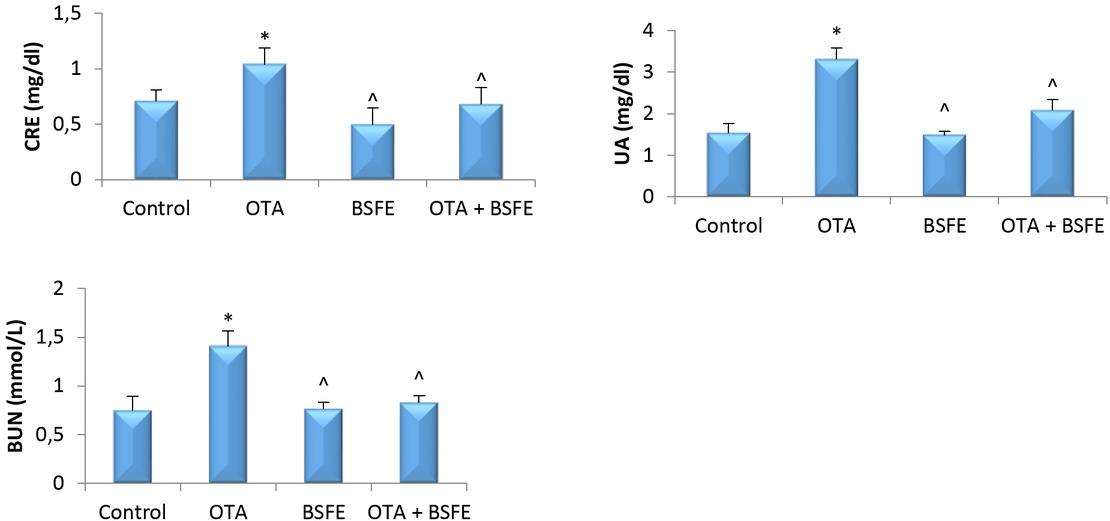
Fig. 4
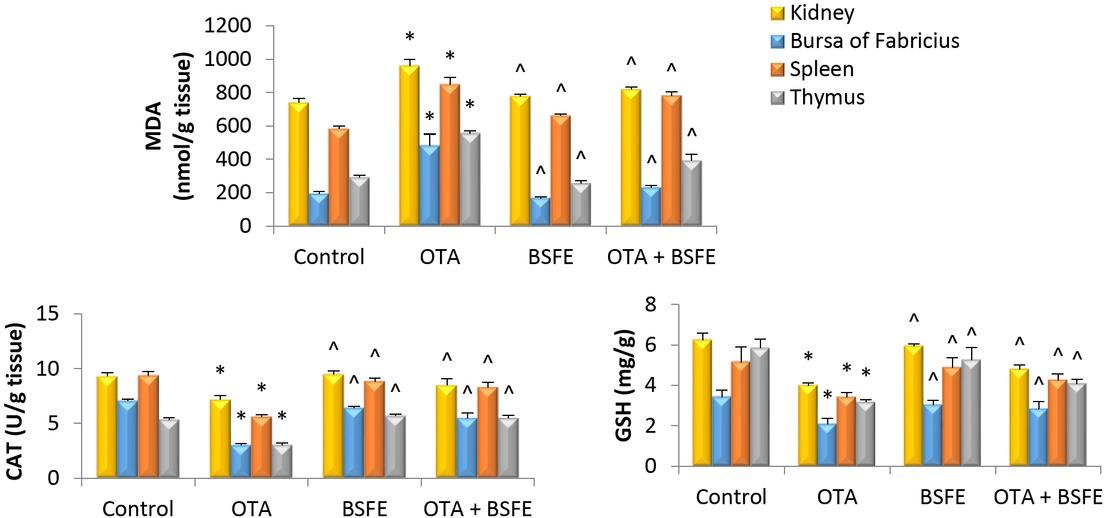
Fig. 5
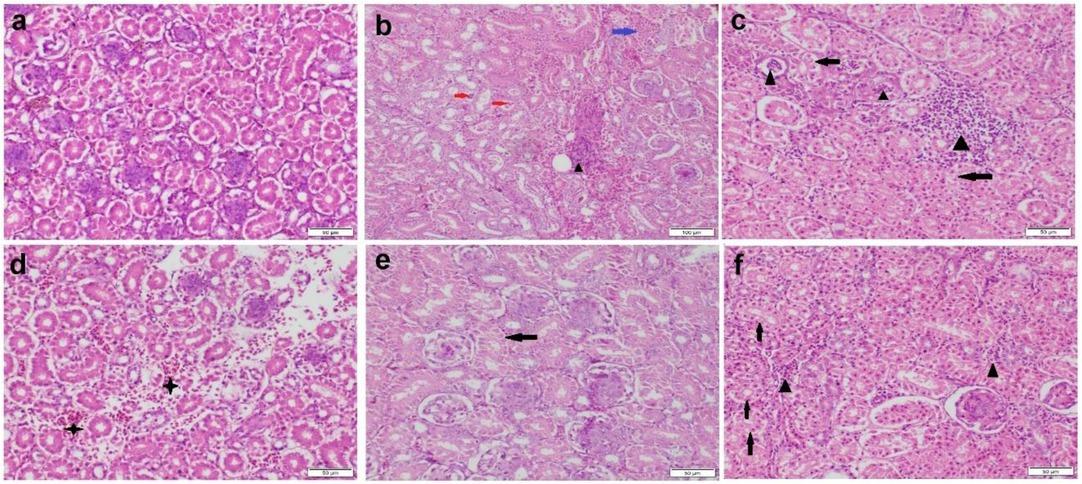
Fig. 6
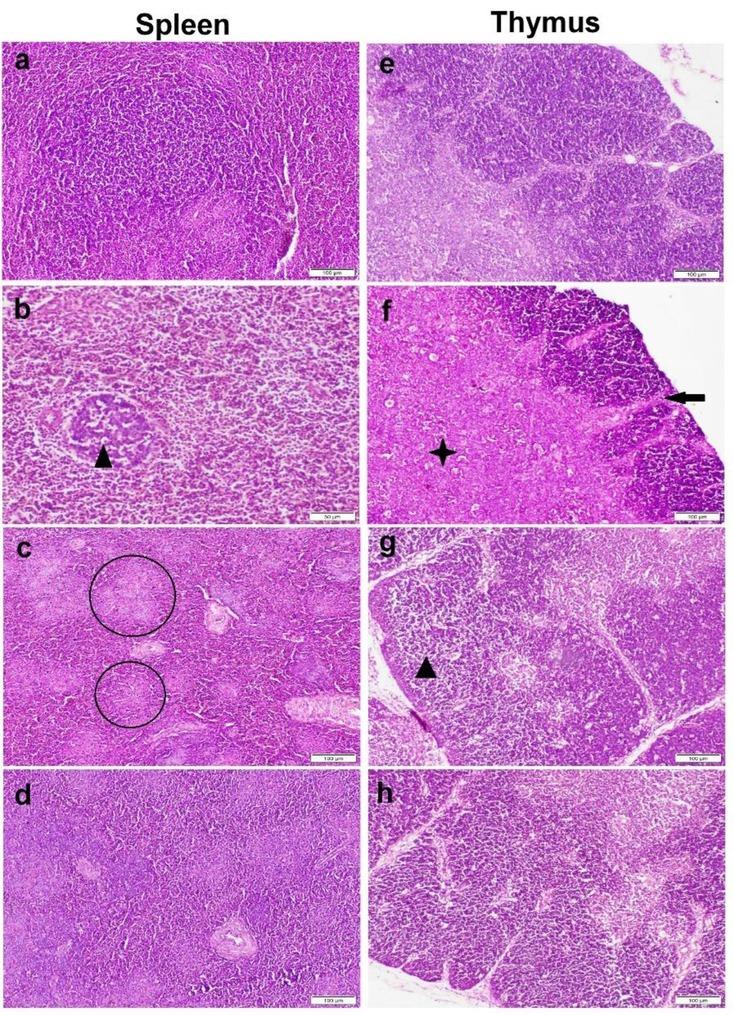
Fig. 7
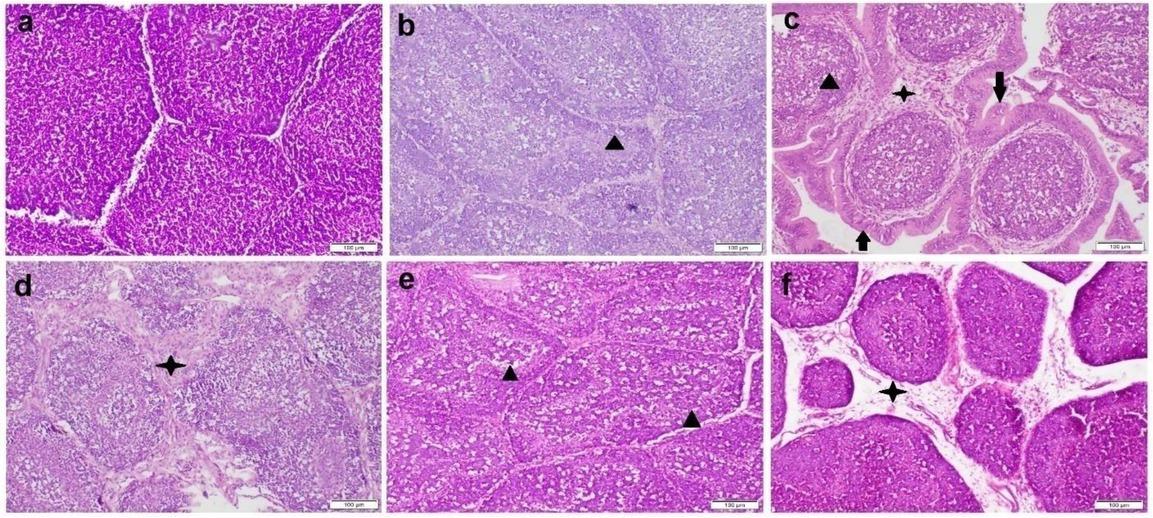
Fig. 8
Microscopic lesion scoring of the examined organs in different groups
| Lesion | Control | OTA | BSFE | OTA + BSFE |
|---|---|---|---|---|
| Microscopic renal lesion scoring | ||||
| RTD | 0 a | 5 b | 0 a | 3 c |
| RTN | 0 a | 5 b | 0 a | 3 c |
| RTP | 0 a | 3 b | 0 a | 2 c |
| Inflammation | 0 a | 5 b | 0 a | 1 c |
| Haemorrhaging | 0 a | 2 b | 0 a | 1 c |
| Congestion | 0 a | 3 c | 1 b | 1 b |
| Glomerular hypercellularity | 0 a | 3 b | 0 a | 0 a |
| Glomerular degeneration | 0 a | 4 b | 0 a | 2 c |
| Microscopic splenic lesion scoring | ||||
| Lymphocytolysis | 0 a | 3 b | 0 a | 0 a |
| Congestion | 0 a | 3 b | 0 a | 1 c |
| Microscopic thymic lesion scoring | ||||
| Lymphocytolysis | 0 a | 4 b | 0 a | 0 a |
| Congestion | 0 a | 2 b | 0 a | 0 a |
| Microscopic bursal lesion scoring | ||||
| Lymphocytolysis | 0 a | 5 b | 0 a | 1 c |
| Congestion | 0 a | 2 b | 0 a | 0 a |
| 0 a | 4 b | 0 a | 0 a | |
Ochratoxin A levels in serum and tissues
| Sample | Control | OTA | BSFE | OTA + BSFE |
|---|---|---|---|---|
| Serum (μg/L) | < LOD1 | 11.3 ± 1.7 | < LOD | 6.6 ± 1.37 ^ |
| Kidney (μg/Kg) | < LOD | 26.67 ± 6.03 | < LOD | 12.3 ± 4.36 ^ |
| Liver (μg/Kg) | < LOD | 14.83 ± 2.84 | < LOD | 5.25 ± 1.52 ^ |
| Muscle (μg/Kg) | < LOD | 8.77 ± 1.97 | < LOD | 2.9 ± 0.85 ^ |
The primer sequences used in gene expression analysis
| Primer | Sequence | Accession number | Amplicon size (bp) |
|---|---|---|---|
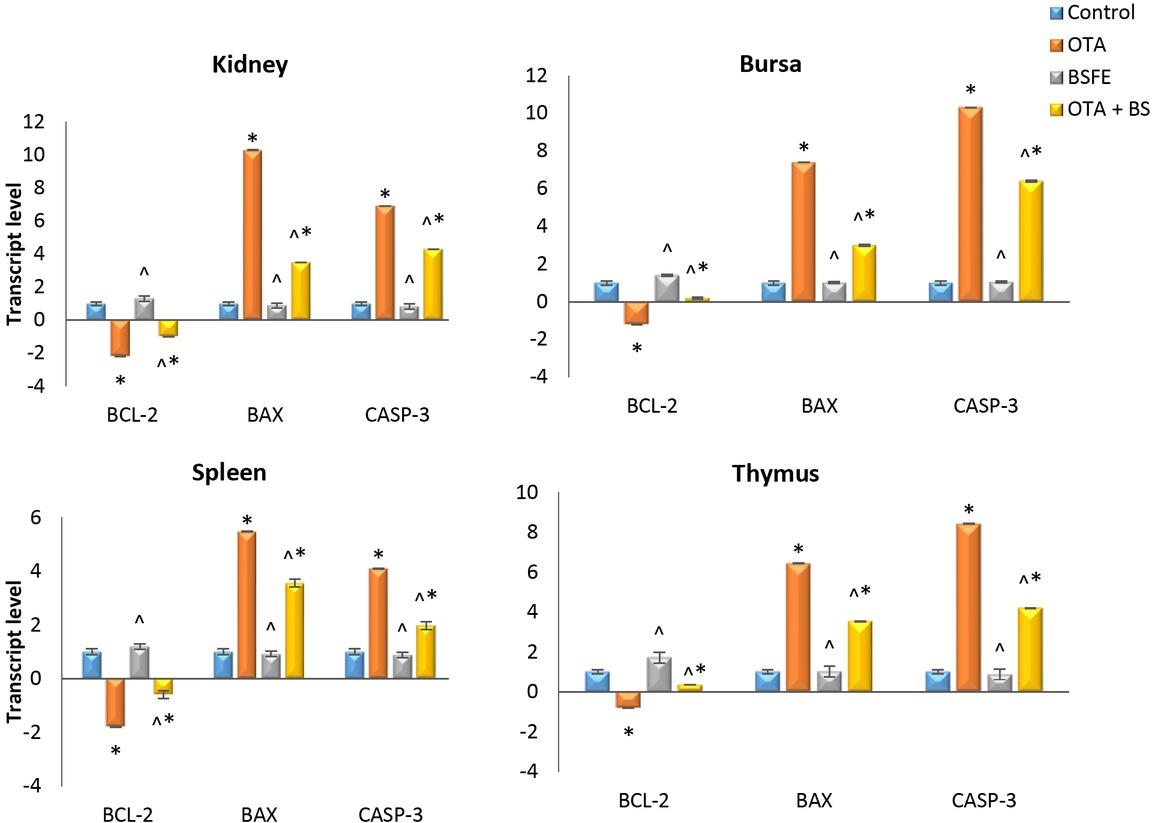
| Bcl-2 | F: TTCAAGCGAAAACAGGGTGG | NM_205339.2 | 167 |
| Bax | F: CACCTTTGTCTCACCTGTGC | XM_015290060.2 | 241 |
| CASP-3 | F: TTGAAGCAGACAGTGGACCA | NM_204725.1 | 177 |
| β-actin | F: CCCACACCCCTGTGATGAAAR: | NM_205518.1 | 177 |