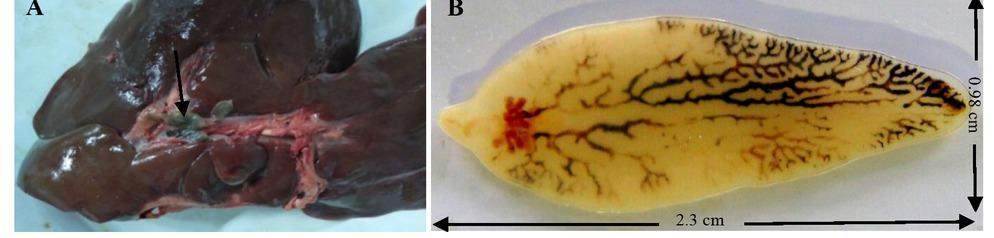
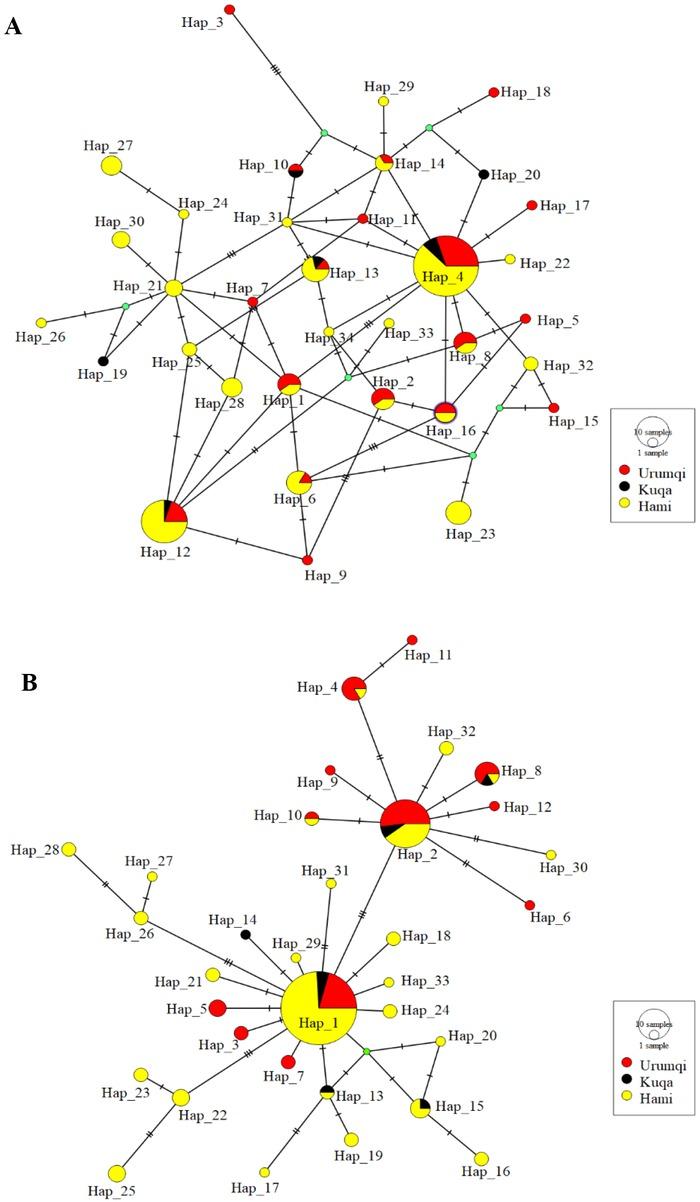
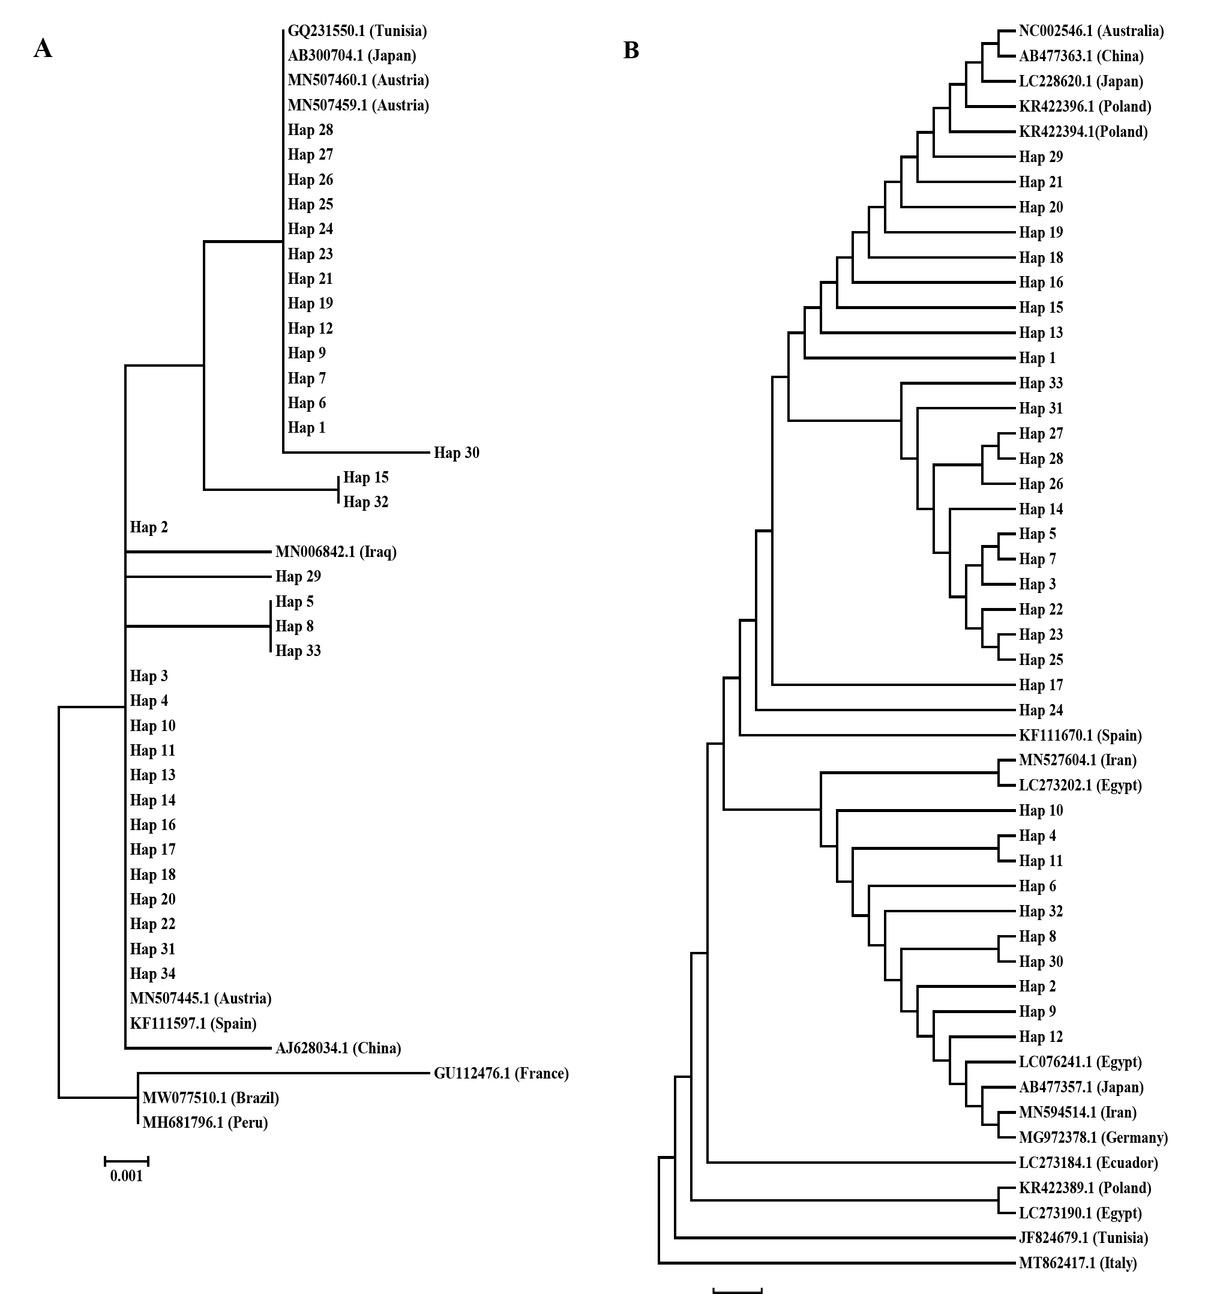
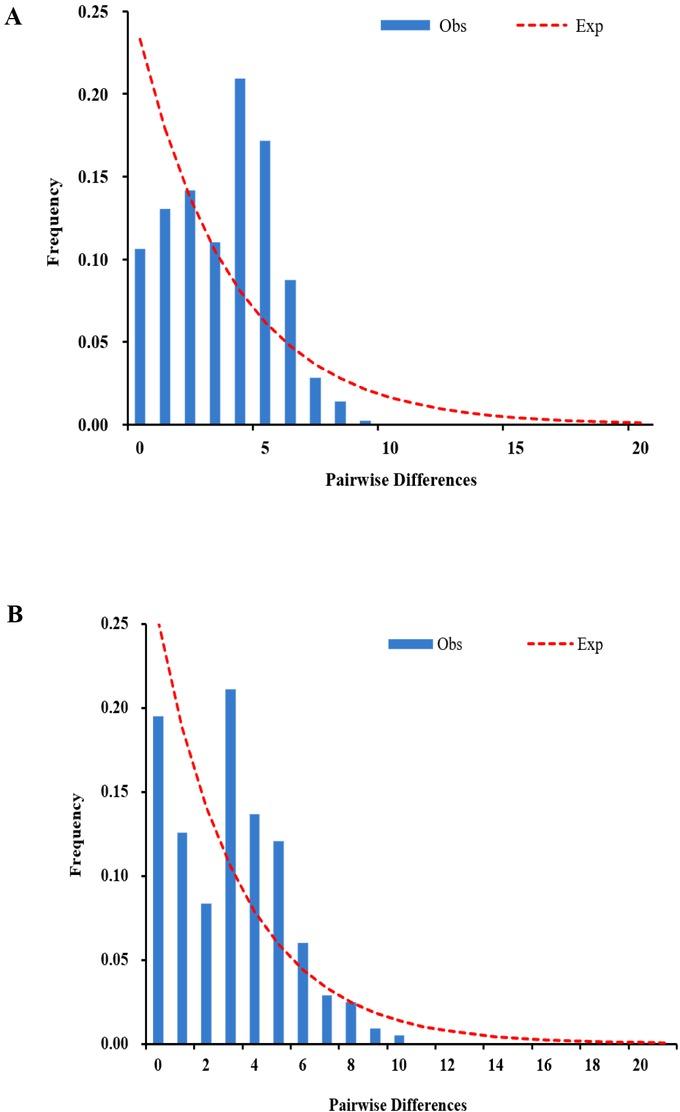
Have a personal or library account? Click to login
Molecular characteristics and genetic diversity of Fasciola hepatica from sheep in Xinjiang, China Cover

Molecular characteristics and genetic diversity of Fasciola hepatica from sheep in Xinjiang, China

Open Access
|Apr 2022

Figures & Tables

Fig. 1

Morphological identification of parasites from sheep. A – parasites found in bile ducts of sheep; B – parasites fixed on slides with 75% alcohol after washing with phosphate buffered saline (0.01M, pH 7.2–7.4)

Fig. 2

Median-joining network of F. hepatica isolates based on cox1 (A) and nad1 (B) genes’ haplotypes. The size of the circle indicates the frequency of the haplotype. The colour of the circle indicates the origin of the population. The green dot represents the default vertex

Fig. 3

Phylogenetic tree of haplotypes of different geographic populations of F. hepatica in Xinjiang. The tree is based on cox1 (A) and nad1 (B) and constructed with the neighbour-joining method

Fig. 4

Mismatch distribution of haplotypes of the cox1 (A) and nad1 (B) genes. The number of nucleotide differences between pairs of sequences is indicated along the x–axis, and their frequency along the y–axis. Obs – observed value; Exp – expected value

Molecular variation analysis based on cox1 and nad1 gene sequences

Source of variationGeneDegrees of freedomSum of squaresVariance componentsPercentage of variation (%)
Withincox114162.9330.44634 Vb99.70
populationsnad114155.7110.39511 Vb96.48
Amongcox120.9900.00133 Va0.30
populationsnad121.8440.01442 Va3.52
Totalcox114363.9240.44767
nad114357.5560.40953
F–statisticcox1 0.04451, P > 0.05
nad1 0.03520, P > 0.05

Genetic diversity parameters of the three geographic populations of F_ hepatica

GenesPopulationsNhHdKπ
Urumqi45180.909 ± 0.000893.1600.00637
cox1Hami90230.890 ± 0.000473.2800.00661
Kuqa960.833 ± 0.016002.7220.00549
Total144340.894 ± 0.000343.2870.00663
Urumqi45120.835 ± 0.001182.6380.00400
nad1Hami90250.7590 ± 0.002182.7780.00421
Kuqa960.889 ± 0.008282.5830.00391
Total144330.805 ± 0.000862.9690.00450

Neutrality indices based on cox1 and nad1 genes of F_ hepatica in different geographical regions of Xinjiang

Populationcox1 nad1

Tajima’s DFu’s FsTajima’s DFu’s Fs
Urumqi–0.74410–7.514–0.72079–2.547
Hami–0.36276–8.659–1.94511*–13.448
Kuqa–0.34120–1.395–0.55536–1.522
Total–1.01276–19.204–1.92702*–19.881
Language: English
Page range: 199 - 207
Submitted on: Sep 14, 2021
Accepted on: Mar 18, 2022
Published on: Apr 22, 2022
Published by: National Veterinary Research Institute in Pulawy
In partnership with: Paradigm Publishing Services
Publication frequency: 4 issues per year

© 2022 Wang Xifeng, Zhang Kai, Zhang Guowu, Li Zhiyuan, Shang Yunxia, Ning Chengcheng, Ji Chunhui, Qiao Jun, Meng Qingling, Cai Xuepeng, published by National Veterinary Research Institute in Pulawy
This work is licensed under the Creative Commons Attribution-NonCommercial-NoDerivatives 3.0 License.