
Fig. 1
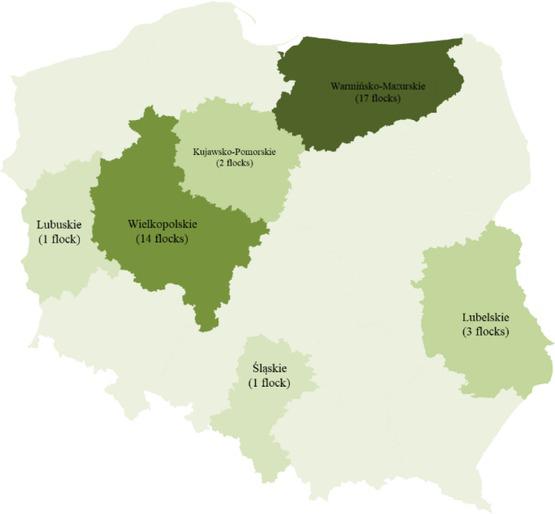
Fig. 2
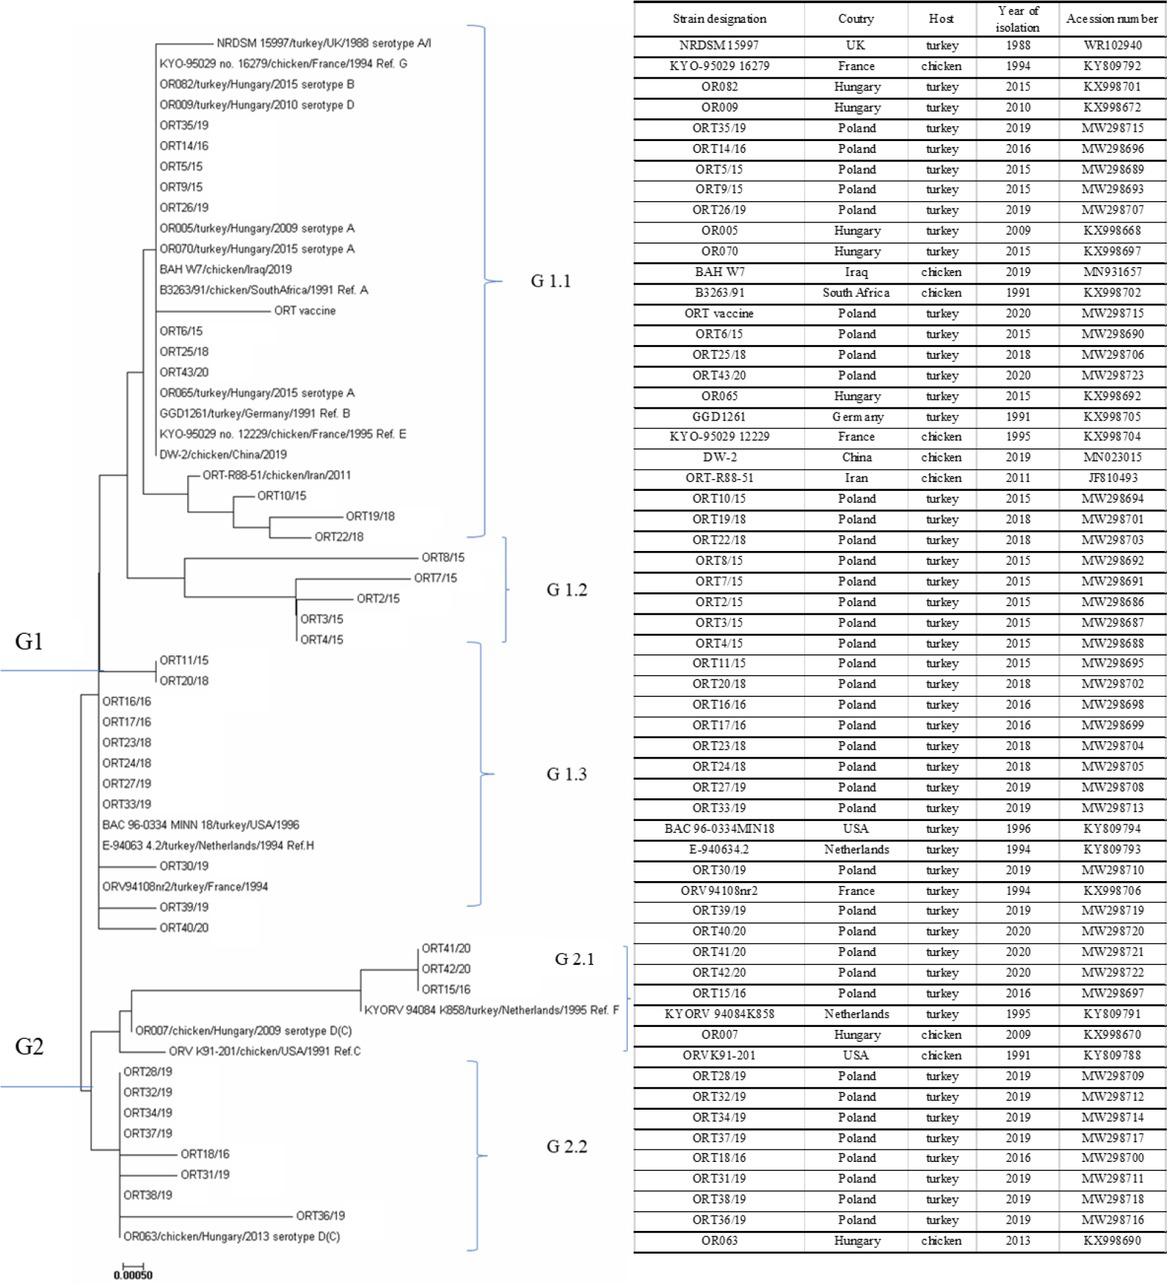
Fig. 3
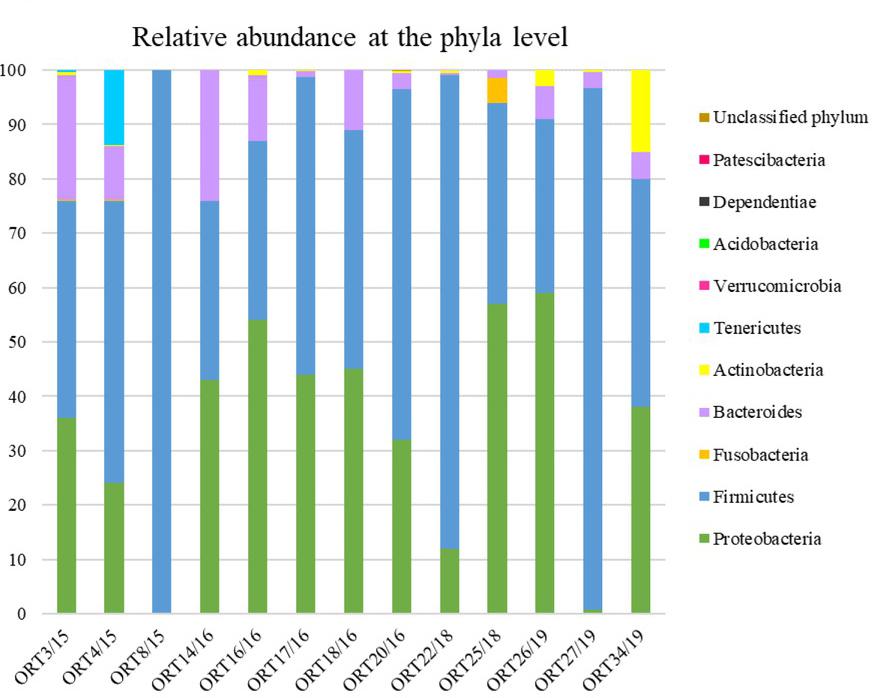
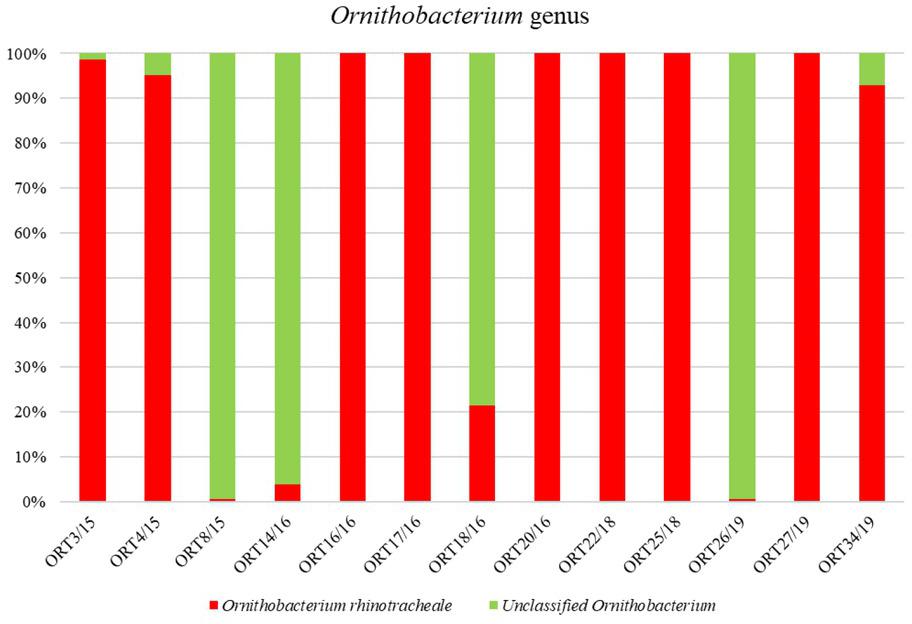
Fig. 4
Number of samples used in this study
| Year | Number of flocks | Samples (flocks) | Number of positive flocks (%) in real-time PCR | Number of positive flocks (%) in PCR | Flocks with signs | |
|---|---|---|---|---|---|---|
| Swabs | Tissue | |||||
| 2015 | 67 | 66 | 1 | 11 (16.42) | 10 | 3 |
| 2016 | 17 | 10 | 7 | 6 (35.29) | 5 | 5 |
| 2017 | 14 | 14 | - | 0 | 0 | 0 |
| 2018 | 10 | 8 | 2 | 6 (60) | 6 | 2 |
| 2019 | 20 | 17 | 3 | 14 (70) | 13 | 3 |
| 2020 | 5 | 3 | 2 | 4 (80) | 4 | 0 |
| Total | 133 | 118 | 15 | 41 (30.83) | 13 | |