
Fig. 1
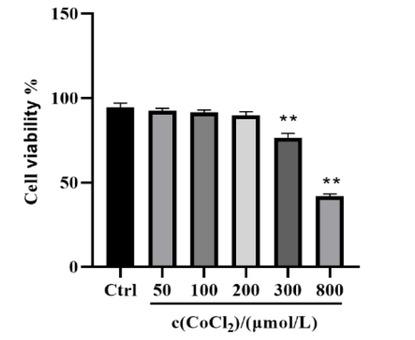
Fig. 2
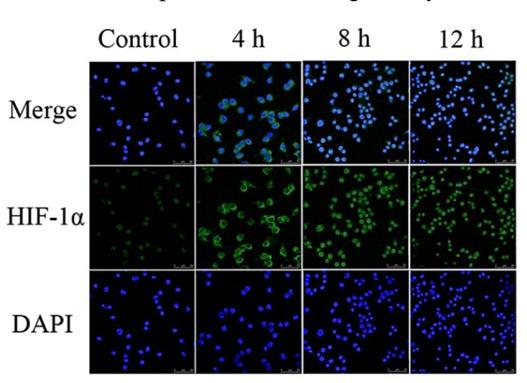
Fig. 3
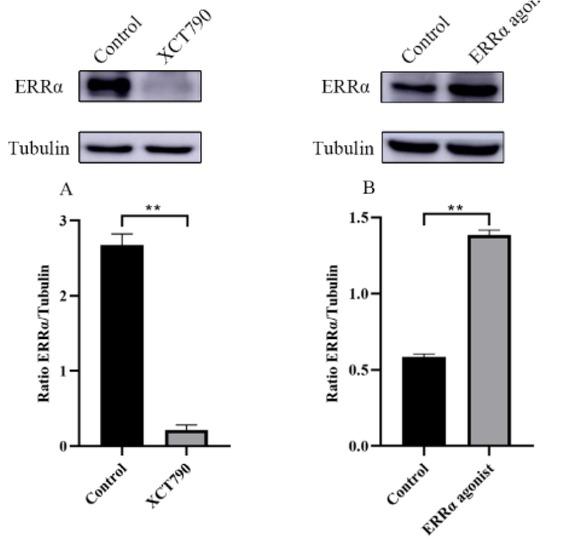
Fig. 4
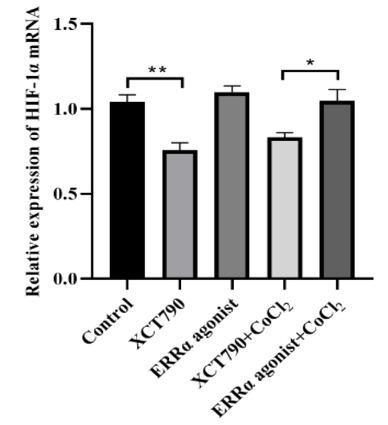
Fig. 5
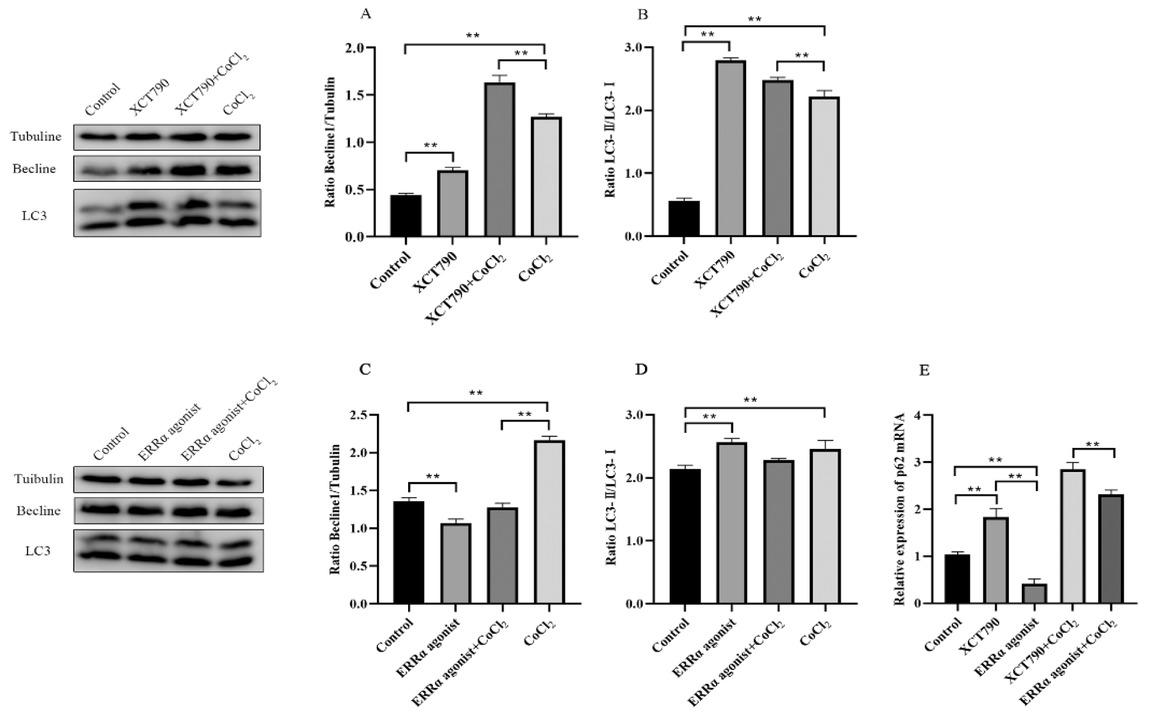
Fig. 6
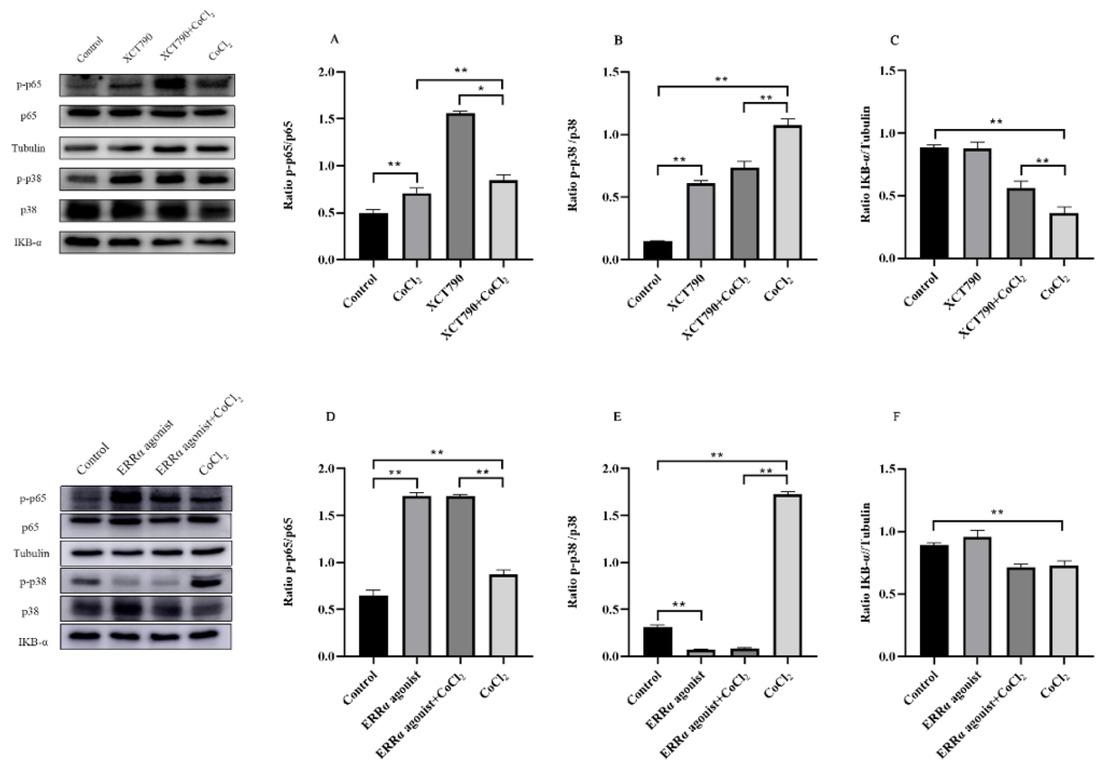
Fig. 7
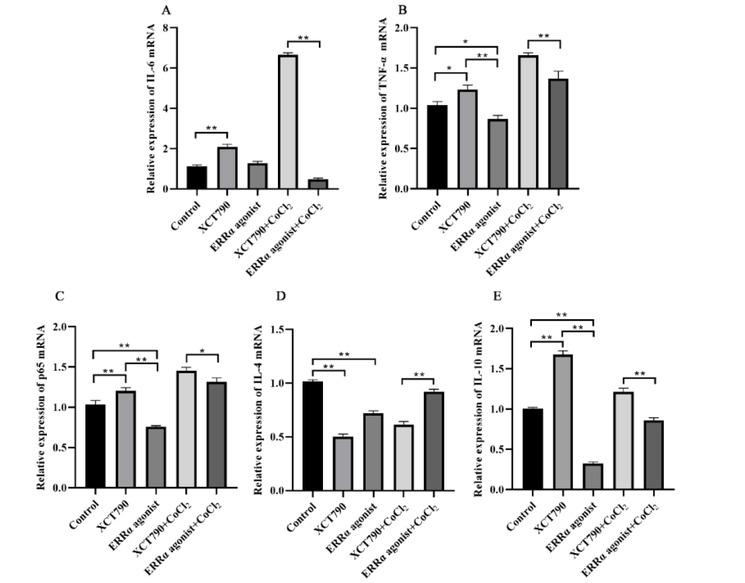
Fig. 8
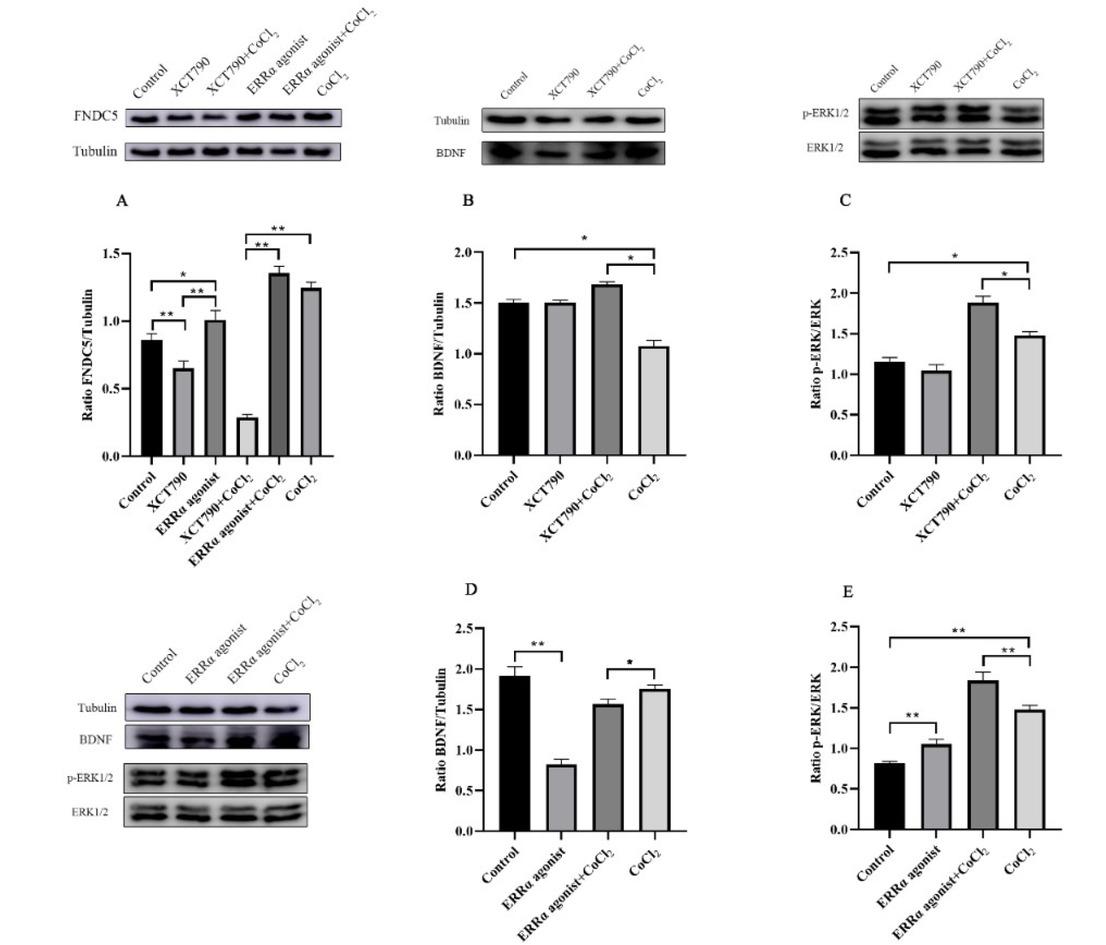
Fig. 9
Primary and secondary antibodies used for Western blotting
| Antibody | Dilution | Catalogue number | |
|---|---|---|---|
| Beclin1 | 1:1,000 | 11306-1-AP | |
| LC3 | 1:1,000 | 14600-1-AP | |
| BDNF | 1:1,000 | 28205-1-AP | |
| FNDC5 | 1:1,000 | 23995-1-AP | |
| p-p65 | 1:1,000 | 19771-1-AP | |
| p65 | 1:2,000 | 10745-1-AP | |
| Primary | p-p38 | 1:1,000 | 19771-1-AP |
| p38 | 1:1,000 | 14064-1-AP | |
| IκB-α | 1:1,000 | 10268-1-AP | |
| P-ERK1/2 | 1:1,000 | 9101 | |
| ERK1/2 | 1:1,000 | 4695S | |
| ERRα | 1:1,000 | 13826 | |
| Tubulin | 1:15,000 | 11224-1-AP | |
| β-actin | 1:15,000 | 60008-1-lg | |
| HRP-conjugated Affinipure Goat Anti-Mouse IgG (H+L) | 1:8,000 | SA00001-1 | |
| Secondary | HRP-conjugated Affinipure Goat Anti-Rabbit IgG (H+L) | 1:8,000 | SA00001-2 |
Primers used for protein amplification
| Protein | Forward primer | Reverse primer |
|---|---|---|
| IL-4 | 5ʹ-GGTCTCAACCCCCAGCTAGT-3ʹ | 5ʹ-GCCGATGATCTCTCTCAAGTGAT-3ʹ |
| IL-10 | 5ʹ-GCTCTTACTGACTGGCATGAG-3′ | 5′-CGCAGCTCTAGGAGCAT GTG-3′ |
| IL-6 | 5ʹ-CCGGAGAGGAGACTTCACAG-3′ | 5′-GGAAAT TGGGGTAGGAAGGA-3′ |
| TNF-α | 5ʹ-TACTGAACTTCGGGGTGAT TGGTCC-3ʹ | 5ʹ-CAGCCTTGTCCCTTGAAGAGAAC-3ʹ |
| P65 | 5ʹ-GTATTGCTG TGCCTACCCGAAAC-3ʹ | 5ʹ-GTTTGAGATCTGCCCTGATGGTAA-3ʹ |
| P62 | 5'-GTTATGGCGTCGTTCACGGT-3′ | 5′-TCACAATGGTGGAGGGTGC-3′ |
| HIF-1 α | 5ʹ-GATGGGTTATGAGCCGGAAGA-3ʹ | 5ʹ-CTGTGGCTGGGAGTTCTTC G-3ʹ |
| β-actin | 5ʹ-CGTTGACATCCGTAAAGACC-3′ | 5′-AACAGTCCGC CTAGAAGCAC-3′ |