
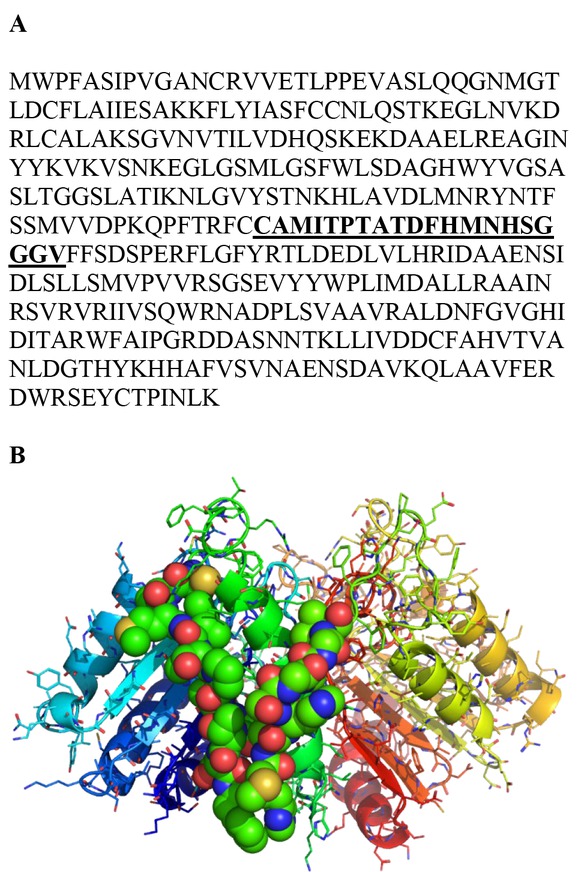
Fig. 1
Selection of the amino acids of the synthetic peptide used for the immunisation of a rabbit (for anti-envelope antibody production). A – Amino acid sequence of the seal parapoxvirus (SPPV) major envelope protein and the selected 20-long sequence (from the 183rd to 202nd amino acid) (bold and underlined). B – The predicted 3D structure of the SPPV major envelope protein was generated by SWISS-MODE (39) and the image was created by using PyMol (www.pymol.org). The coloured balls (four different colours) represent the atoms composing the selected amino acids
Table 1
Marine mammal species used in this study
| Species | Animal identification | Sex | Age in years (as of October, 2020) |
|---|---|---|---|
| Spotted seal (Phoca largha) | PL1 PL2 | F M | 11 10 |
| DL1 | M | 42 | |
| DL5 | F | 21 | |
| Beluga whale (Delphinapterus leucas) | DLDL6 9 | F F | 25 13 |
| DL11 | M | 8 | |
| DL12 | M | 12 | |
| LO2 | M | 20 | |
| Pacific white-sided dolphin (Lagenorhynchus obliquidens) | LO4 | F | 21 |
| LO5 | F | 11 | |
| TTC | F | 20 | |
| TTH | M | 4 | |
| TTL | F | 23 | |
| TTP | M | 23 | |
| Bottlenose dolphin (Tursiops truncatus) | TTQ TTR | M F | 22 3 |
| TTS | M | 2 | |
| TTT | M | 25 | |
| TTW | F | 20 | |
| TTX | F | 21 |
Table 2
Optimisation of the enzyme-linked immunosorbent assay (ELISA) conditions
| Factor | Optimal condition | Other evaluated but not chosen conditions |
|---|---|---|
| Transfection reagent | Lipofectamine LTX | FuGENE HD (E2311, Promega, Madison, WI, USA), and Polyethylenimine HCL MAX (24765, Polysciences, Taiwan) |
| Cell lysis buffer | Using both RIPA and denaturing lysis buffers | 1lysis % NPbuffer 40, RIPA alone buffer alone, and denaturing |
| Antigen preparation | Pellets of lysed cells | Supernatants of lysed cells, and whole cells lysed in the dish without pelleting |
| Time of collection of transfected cells (hours post transfection) | 48 | 60 |
| Antigen concentration | 25 μg/well (100 μL/well at 0.25 μg/μL) | 6.25, 12.5, 50, 100, and 200 μg/well |
| Blocking reagent | PBS containing 1% Block ACE | c-block-e, h-block-e, k-block-e, and b-block-e (BCL-BKSE-01, Beacle, Kyoto, Japan) |
| Primary sera/plasma dilution | 1:50 (100 μL/well) diluted in PBS-T containing 0.4% Block ACE | 1:100 |
| HRP-conjugated protein A/G dilution | 1:10,000 (100 μL/well) diluted in PBS-T containing 0.4% Block ACE | 1:5,000 |
[i] RIPA – radioimmunoprecipitation; NP40 – nonyl phenoxypolyethoxylethanol 40; PBS – phosphate-buffered saline; PBS-T – phosphate-buffered saline with Tween 20; HRP – horseradish peroxidase. The RIPA lysis buffer was 1% sodium deoxycholate, 1% Triton X-100, 10 mM Tris-HCl, pH 7.4, 150 mM NaCl, and 0.5 mM ethylenediaminetetraacetic acid
The denaturing lysis buffer was 2% sodium dodecyl sulphate, 770 mg dithiothreitol, and 4.5 mL of 500 mM Tris-HCl, pH 6.8, in 10 mL of PBS
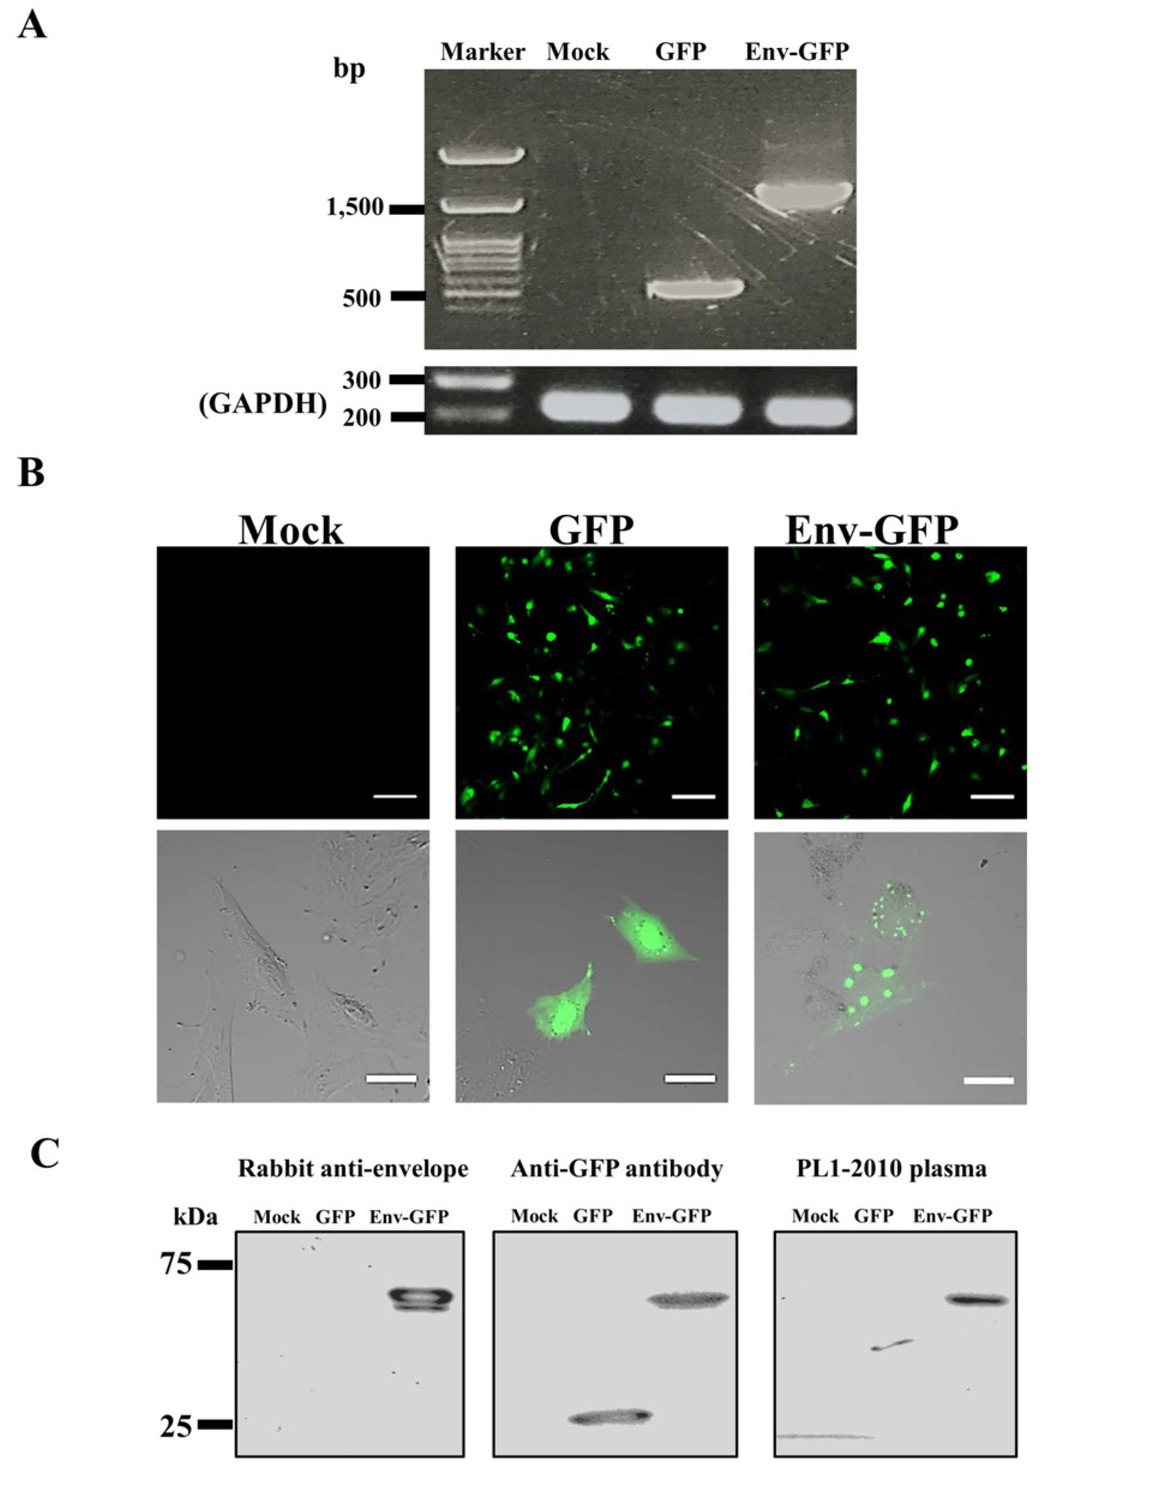
Fig. 2
Confirmation of seal parapoxvirus envelope gene cloning and expression of the green fluorescence protein (GFP) and fusion protein (Env-GFP) in transfected cells. A – Results of the PCR using DNA extracted from transfected cells (mock, empty, and cloned vectors) at 48 hours post transfection (hpt); B – Upper panels: confocal microscopic photos of transfected cells (mock, empty, and cloned vectors) at 48 hpt showing the expression of GFP and Env-GFP (low magnification, scale bar 200 μm). Lower panels: the distribution of GFP and Env-GFP inside transfected cells (high magnification, scale bar 30 μm); C – 48 hpt results of Western blotting using the transfected cell lysates (mock, empty, and cloned vectors) and the rabbit anti-envelope serum, anti-GFP antibody, or PL1-2010 plasma, illustrating the expression of GFP and Env-GFP in transfected cells by the detection of specific bands of both proteins
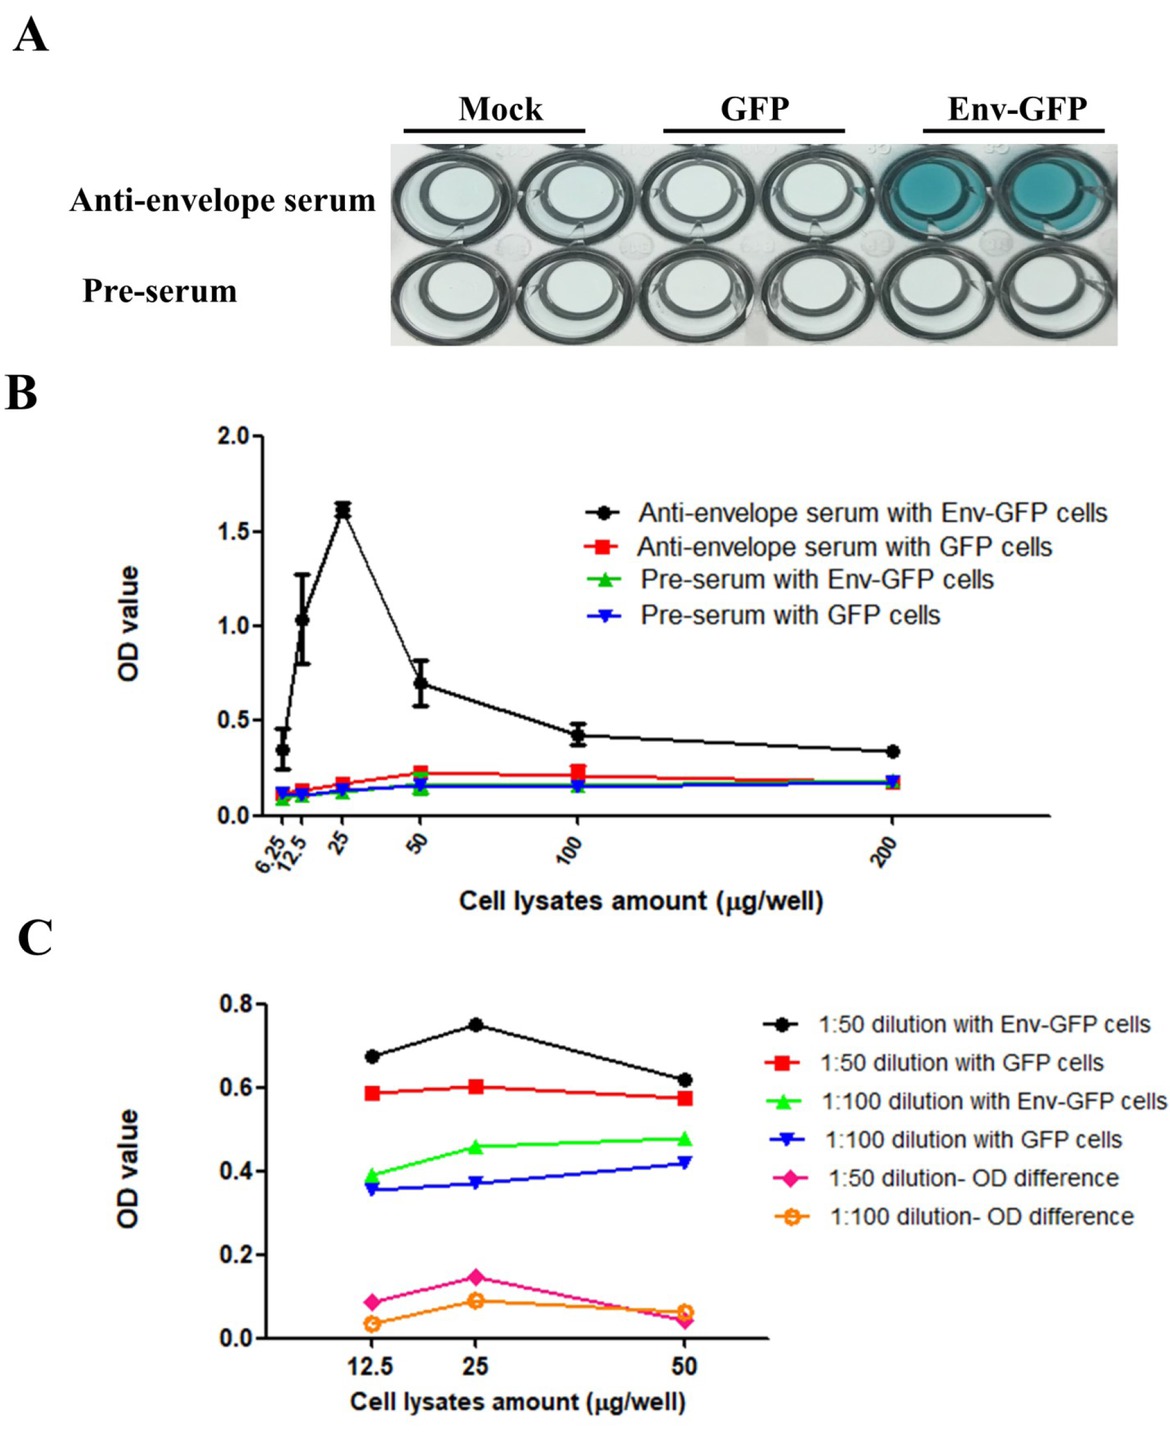
Fig. 3
Optimisation of the ELISA cell lysates and primary antibody concentrations. A – Colour reactions in the ELISA plate wells coated with mock, green fluorescence protein (GFP), or fusion protein (Env-GFP) cell lysates (25 μg/well) and incubated with either rabbit anti-envelope serum or pre-serum (1:50 dilutions); B – Optical density (OD) values detected using either rabbit anti-envelope serum or pre-serum at 1:50 dilution in either Env-GFP lysate– or GFP cell lysate–coated wells at different concentrations. Data are shown as means ± SD for two separate experiments; C – OD values detected using PL1-2010 plasma at either 1:50 or 1:100 dilution with different concentrations of Env-GFP lysate– or GFP cell lysate–coated wells, in addition to the OD difference in each case (subtracting the GFP OD value from the Env-GFP OD value)
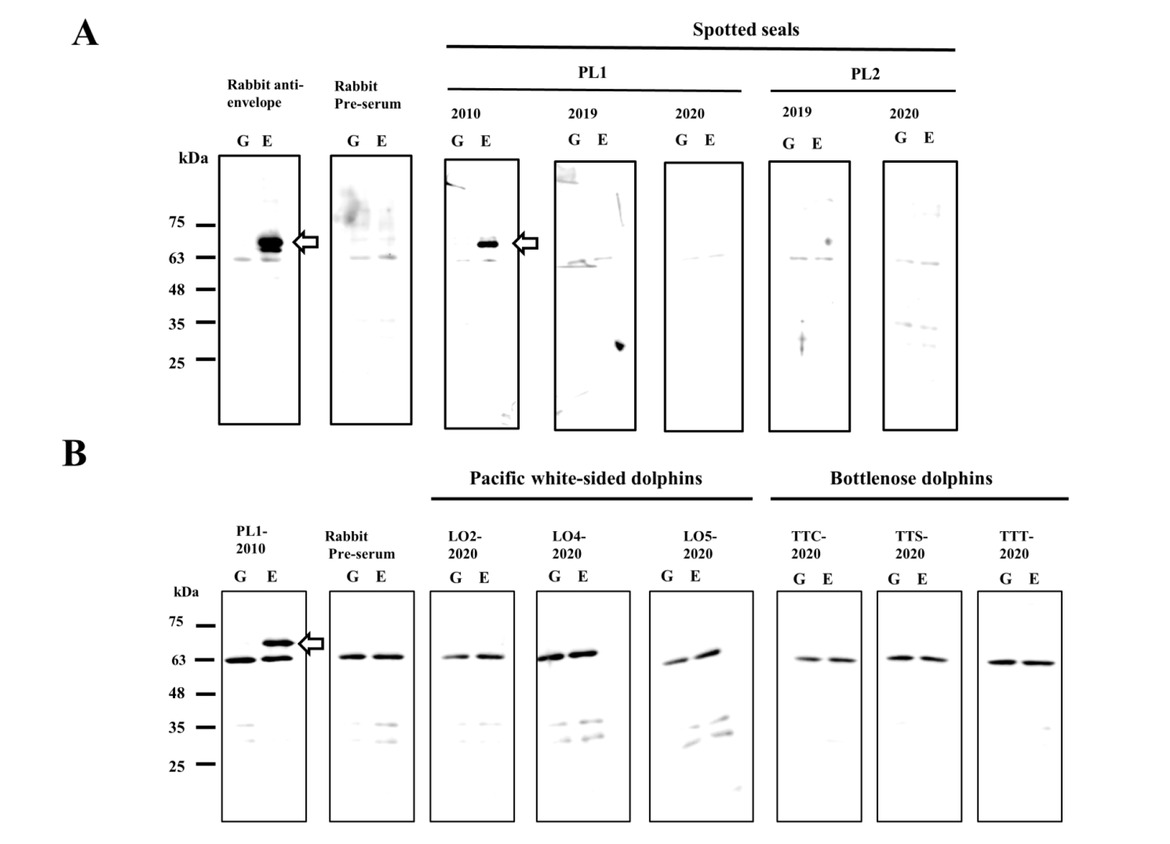
Fig. 4
Western blotting assay to examine the reactivity of selected serum samples. Transfected cell lysates, green fluorescence protein (GFP) (G lane) and fusion protein (Env-GFP) (E lane), were loaded as the antigens, horseradish peroxidase-conjugated protein A/G was used in place of the secondary antibody, and sera from rabbit (anti-envelope and/or pre-serum) were used as primary antibodies with A – Primary antibodies from all spotted seals or; B – Primary antibodies from selected cetaceans. Arrows – Specific bands in the E lanes at approximately 70 kDa indicating positive reactions only with the rabbit anti-envelope serum and PL1-2010 plasma. A protein ladder showing different sizes is provided on the left