
Table 1
Nucleotide sequences of PCV4 primers and PCV4 probe
| Primer | Nucleotide sequence (5ʹ–3ʹ) | Nt position |
|---|---|---|
| PCV4-F | AATCTCACTGTCCACACCTG | 1105–1124 |
| PCV4-R | CAAAACCCCAGGACCCATC | 1267–1249 |
| PCV4-probe | FAM-ACCCACACCCTCCACTTCCAGC-BHQ1 |
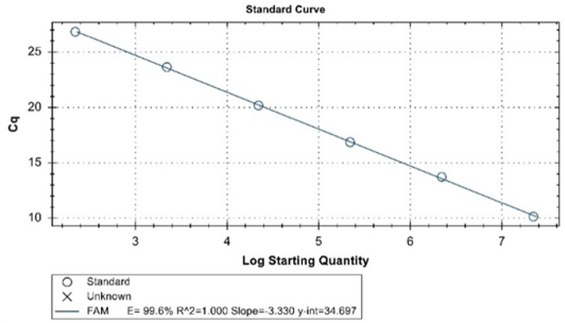
Fig. 1
Standard curve of PCV4 real-time PCR for serially diluted pMD19T-PCV4 recombinant plasmids. Mean threshold cycle (Ct) values from three replicates (y-axis) are plotted versus logarithmic concentrations of plasmid copies (x-axis)
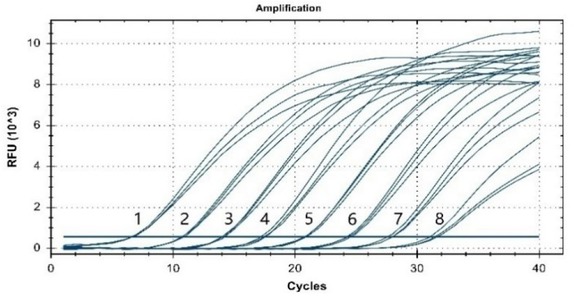
Fig. 2
Sensitivity analysis of the TaqMan real-time PCR for PCV4. RFU – relative fluorescence units; 1–8 – 2.2 × 10⁸ copies/μL–2.2 × 101 copies/μL. The lowest copy number detected by qPCR was 2.2 × 101 copies/μL
Table 2
Repeatability test of qPCR
| Positive plasmid concentration | Intra-assay | Inter-assay | ||
|---|---|---|---|---|
| (copies/μL) | Ct (mean ± SD) | CV % | Ct (mean ± SD) | CV % |
| 2.20 × 10⁵ | 18.15 ± 0.22 | 1.21 | 18.14 ± 0.25 | 1.38 |
| 2.20 × 10⁴ | 21.48 ± 0.14 | 0.65 | 21.49 ± 0.18 | 0.84 |
| 2.20 × 10³ | 24.98 ± 0.16 | 0.64 | 24.92 ± 0.28 | 1.12 |
| 2.20 × 10² | 28.56 ± 0.36 | 1.26 | 28.53 ± 0.48 | 1.68 |