
Fig. 1
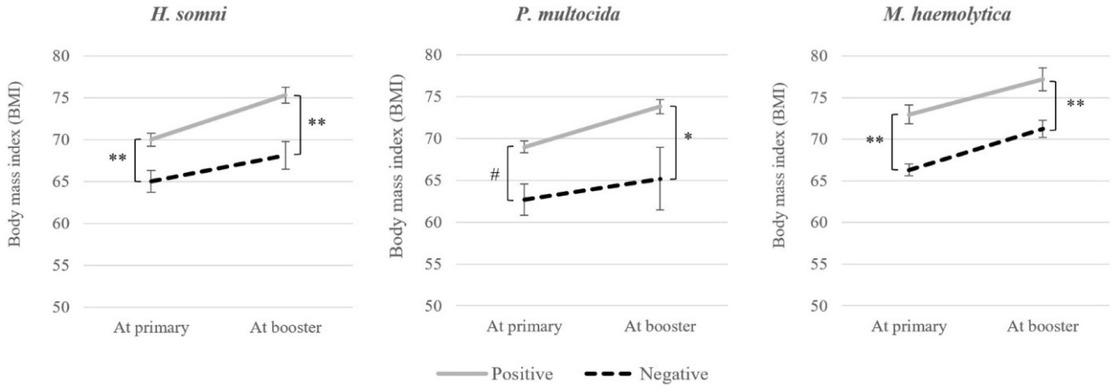
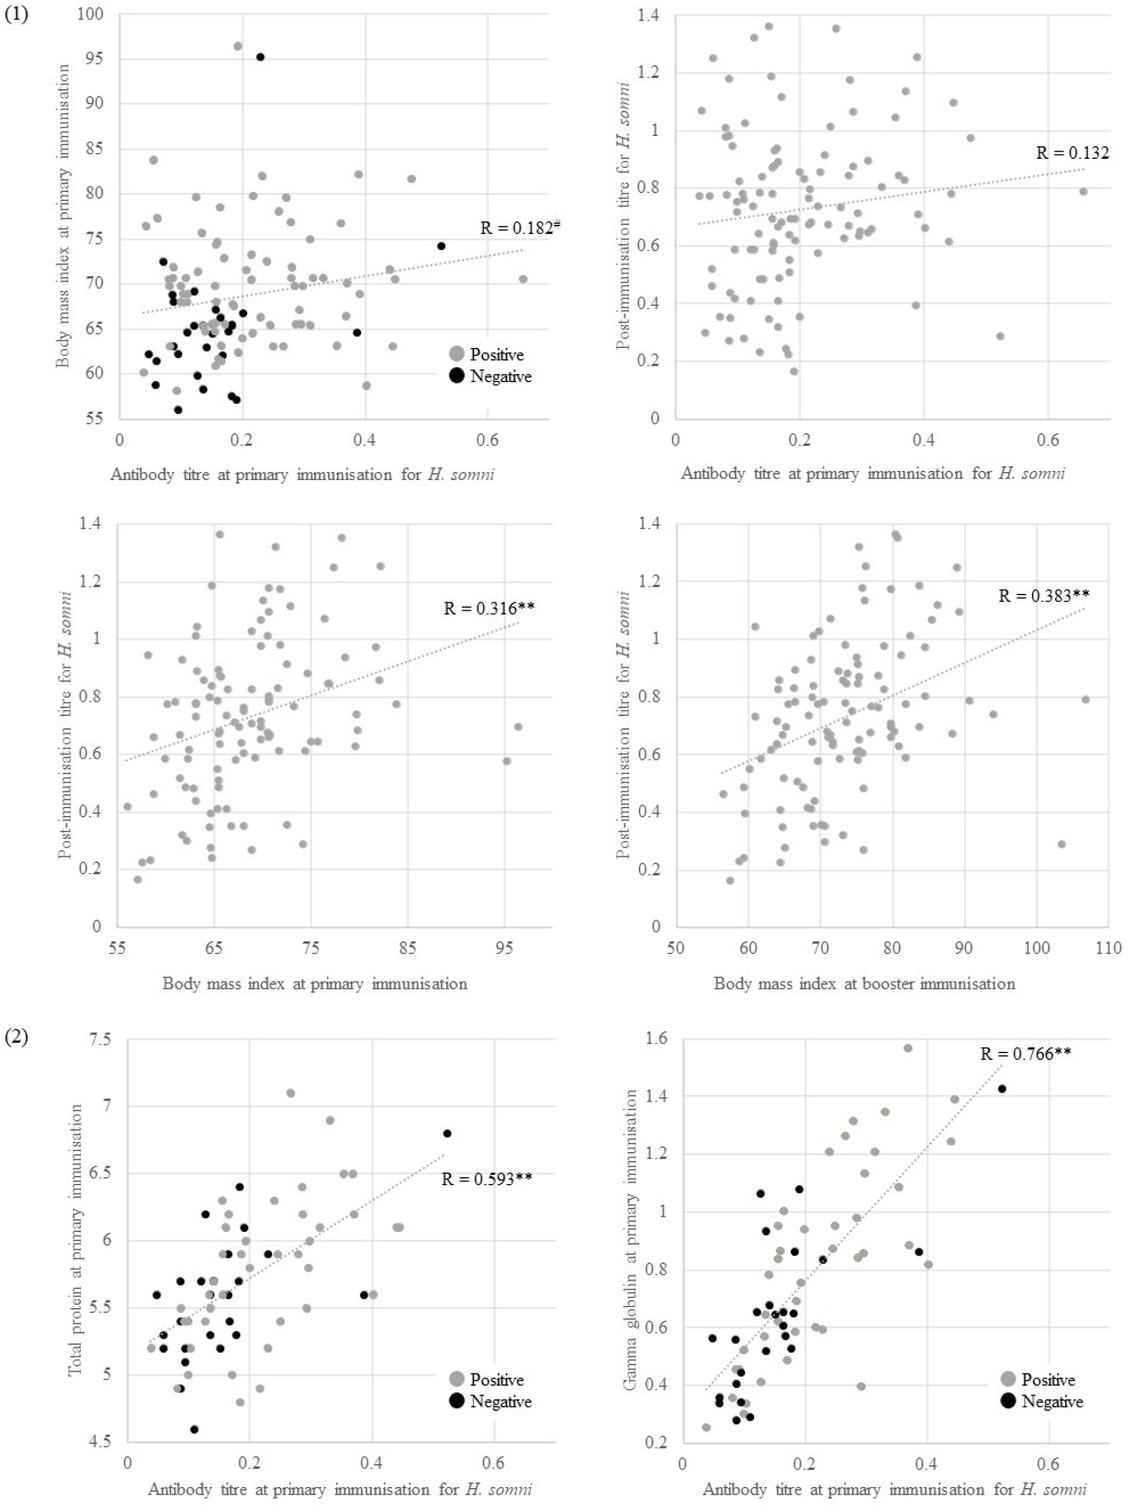
Fig. 2
The number of positive and negative calves following immunisation (a) in each experiment and (b) for each MAL in the first experiment
| (a) | Experiment | Antibody titre | BMI | Nutritional status | Oxidative stress | Positive | Negative |
|---|---|---|---|---|---|---|---|
| First | ✓ | ✓ | 77 | 30 | |||
| H. somni | Second | ✓ | ✓ | ✓ | 41 | 25 | |
| Third | ✓ | ✓ | ✓ | ✓ | 25 | 22 | |
| First | ✓ | ✓ | 101 | 6 | |||
| P. multocida | Second | ✓ | ✓ | ✓ | 61 | 5 | |
| Third | ✓ | ✓ | ✓ | ✓ | 42 | 5 | |
| First | ✓ | ✓ | 37 | 70 | |||
| M. haemolytica | Second | ✓ | ✓ | ✓ | 8 | 58 | |
| Third | ✓ | ✓ | ✓ | ✓ | 8 | 39 | |
| (b) | MAL | Positive | Negative | P value | |||
| 50 | 38 | 4 | |||||
| 100 | 45 | 1 | |||||
| P. multocida | 200 | 15 | 1 | - | |||
| 400 | 3 | 0 | |||||
| 50 | 3 | 16 | 0.058 | ||||
| 100 | 9 | 28 | 0.105 | ||||
| M. haemolytica** | 200 | 12 | 19 | 0.566 | |||
| 400 | 11 | 7 | 0.009** | ||||
| 800 | 2 | 0 | 0.050* | ||||
Pearson’s correlation analysis
| First experiment | Maternal antibody titre | Body mass index | Post-immunisation titre | ||||||
|---|---|---|---|---|---|---|---|---|---|
| H. | P. | M. | At | At | H. | P. | M. | ||
| somni | multocida | haemolytica | primary | booster | somni | multocida | haemolytica | ||
| Maternal antibody titre | H. somni | - | |||||||
| P. multocida | 0.530** | - | |||||||
| M. haemolytica | 0.438** | 0.492** | - | ||||||
| At primary | 0.182 | 0.048 | 0.198* | - | |||||
| Body mass index | At booster | 0.362** | 0.298** | 0.208* | 0.446** | - | |||
| H. somni | 0.132 | 0.152 | 0.142 | 0.316** | 0.383** | - | |||
| Post-immunisation | P. multocida | −0.033 | 0.132 | 0.085 | 0.370** | 0.347** | 0.452** | - | |
| titre | M. haemolytica | 0.061 | 0.227* | 0.264** | 0.389** | 0.278** | 0.357** | 0.510** | - |
The nutritional status in the second experiment (a) and oxidative stress marker values in the third experiment (b)
| (a) | H. somni | P. multocida | M.haemolytica | ||||
|---|---|---|---|---|---|---|---|
| Positive | Negative | Positive | Negative | Positive | Negative | ||
| Total cholesterol | P | 93.6 ± 5.3 | 98.5 ± 5.1 | 96.1 ± 4.0 | 88.2 ± 13.4 | 79.3 ± 8.3 | 97.7 ± 4.1 |
| (mg/dL) | B | 118.3 ± 5.2 | 118.6 ± 4.6 | 118.7 ± 3.8 | 114.4 ± 12.8 | 113.8 ± 10.0 | 119.0 ± 3.9 |
| Blood urea nitrogen | P | 12.1 ± 0.7 | 10.9 ± 0.4 | 11.7 ± 0.5 | 10.4 ± 0.6 | 13.3 ± 2.3 | 11.4 ± 0.5 |
| (mg/dL) | B | 9.3 ± 0.3 | 10.4 ± 0.4 | 9.6 ± 0.2 | 11.4 ± 0.4 | 9.3 ± 0.6 | 9.8 ± 0.2 |
| Total protein | P | 5.8 ± 0.1* | 5.6 ± 0.1 | 5.7 ± 0.1 | 5.5 ± 0.2 | 6.0 ± 0.2 | 5.7 ± 0.1 |
| (g/dL) | B | 6.0 ± 0.1 | 5.9 ± 0.1 | 6.0 ± 0.0 | 6.1 ± 0.2 | 6.0 ± 0.1 | 6.0 ± 0.0 |
| Albumin/globulin | P | 1.04 ± 0.03 | 1.08 ± 0.04 | 1.05 ± 0.03 | 1.11 ± 0.10 | 0.91 ± 0.08* | 1.08 ± 0.02 |
| ratio | B | 1.15 ± 0.03 | 1.17 ± 0.03 | 1.16 ± 0.02 | 1.14 ± 0.08 | 1.07 ± 0.03 | 1.17 ± 0.02 |
| Albumin | P | 2.90 ± 0.04 | 2.87 ± 0.05 | 2.89 ± 0.03 | 2.87 ± 0.10 | 2.76 ± 0.08 | 2.91 ± 0.04 |
| (g/dL) | B | 3.19 ± 0.03 | 3.16 ± 0.04 | 3.18 ± 0.03 | 3.25 ± 0.09 | 3.11 ± 0.06 | 3.19 ± 0.03 |
| Alpha globulin | P | 1.06 ± 0.02 | 1.07 ± 0.03 | 1.06 ± 0.02 | 1.11 ± 0.07 | 1.15 ± 0.08 | 1.06 ± 0.02 |
| (g/dL) | B | 0.97 ± 0.02 | 0.99 ± 0.02 | 0.97 ± 0.02 | 1.04 ± 0.05 | 0.99 ± 0.03 | 0.97 ± 0.02 |
| Beta globulin | P | 1.00 ± 0.03 | 0.99 ± 0.03 | 1.00 ± 0.02 | 0.91 ± 0.06 | 1.05 ± 0.07 | 0.99 ± 0.02 |
| (g/dL) | B | 1.01 ± 0.02 | 1.01 ± 0.02 | 1.01 ± 0.01 | 1.04 ± 0.05 | 1.01 ± 0.05 | 1.01 ± 0.01 |
| Gamma globulin | P | 0.81 ± 0.05* | 0.65 ± 0.06 | 0.76 ± 0.04 | 0.63 ± 0.12 | 0.98 ± 0.15* | 0.72 ± 0.04 |
| (g/dL) | B | 0.83 ± 0.03* | 0.75 ± 0.04 | 0.80 ± 0.03 | 0.79 ± 0.07 | 0.92 ± 0.09 | 0.78 ± 0.03 |