
Fig. 1
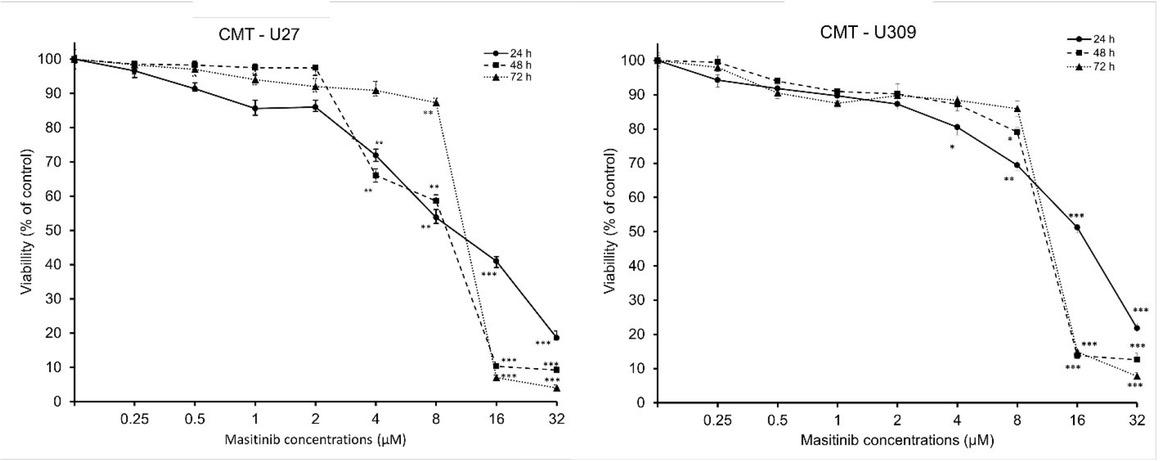
Fig. 2
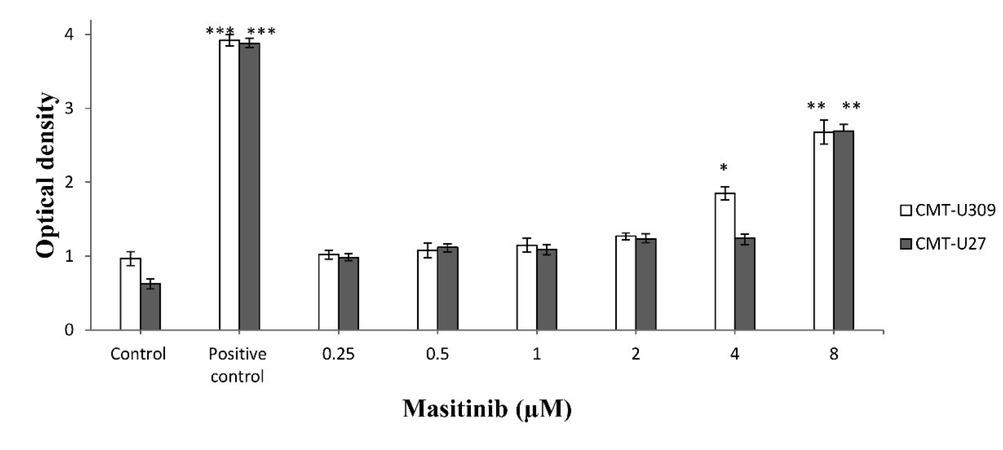
Fig. 3
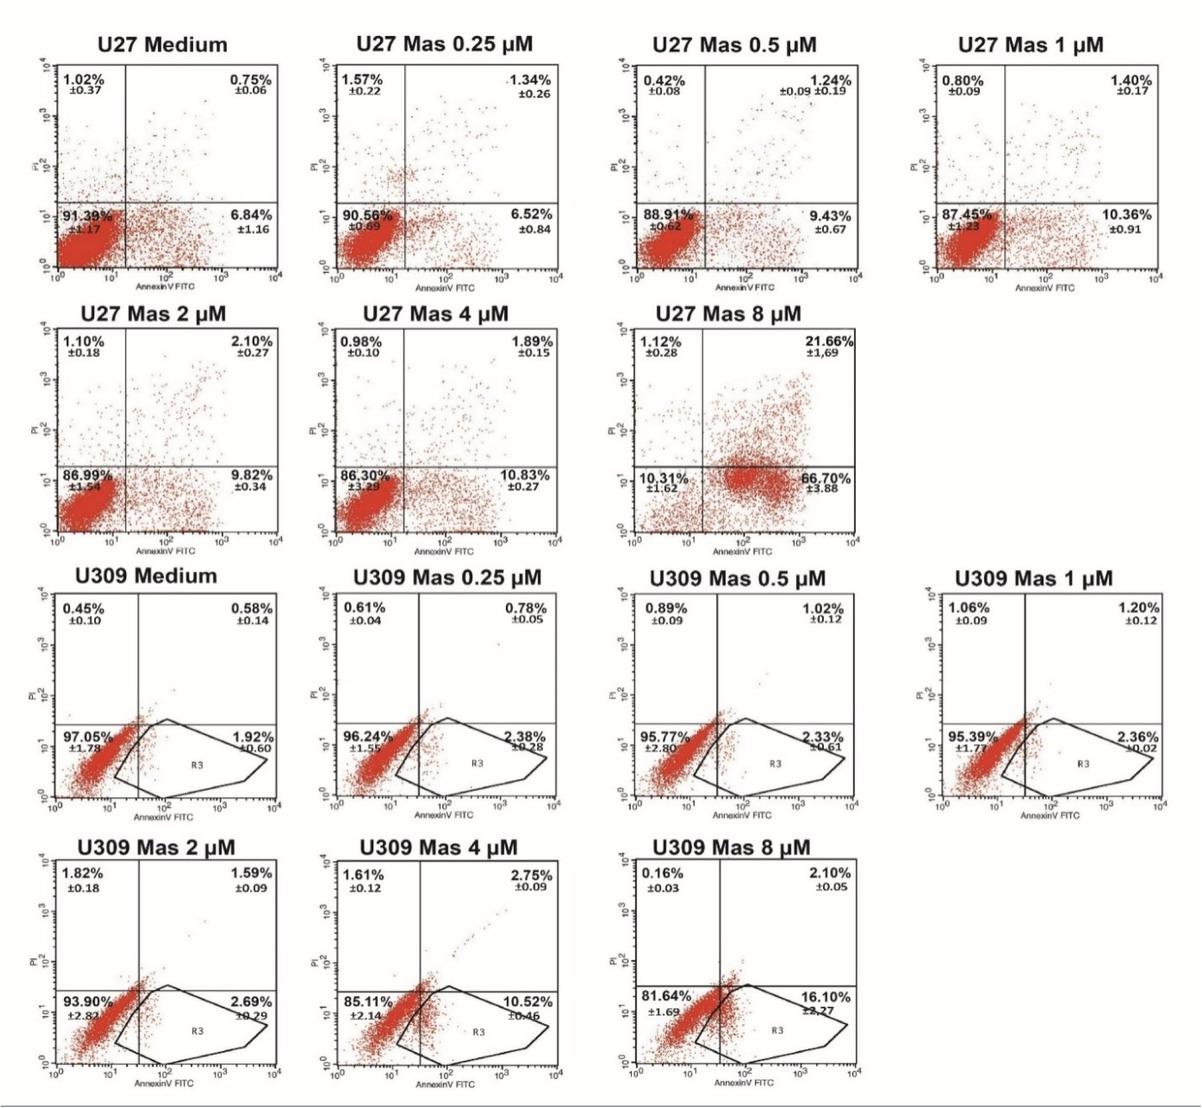
Fig. 4
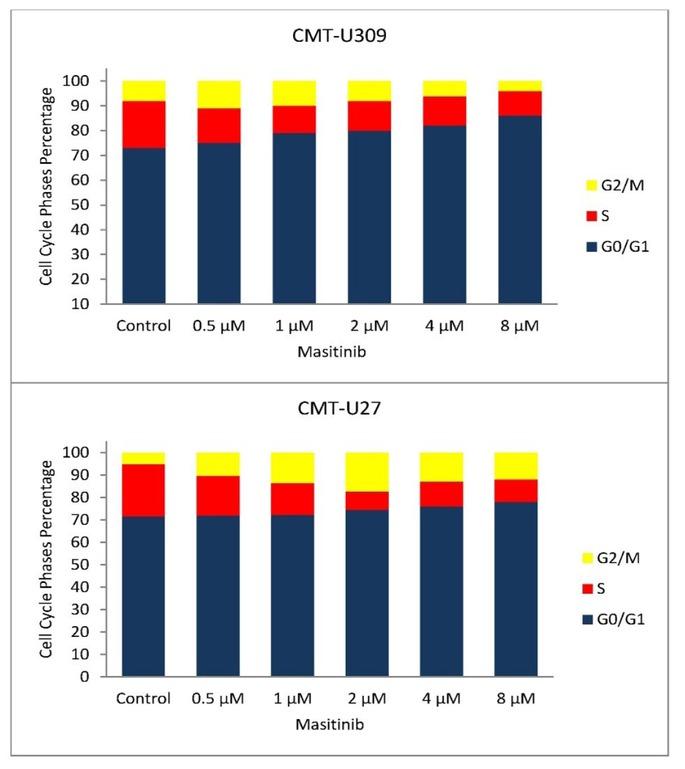
Fig. 5
Fig. 6
VEGF concentrations in the supernatant of control and masitinib treated CMT cells after 72 h
| Masitinib concentration | CMT-U27 VEGF concentration (pg/mL) | CMT-U309 VEGF concentration (pg/mL) |
|---|---|---|
| Control | 536.5 ± 19.01 | 287.8 ± 14.25 |
| 0.25 μM | 504.64 ± 21.92 | 247.38 ± 14.98 |
| 0.5 μM | 439.48 ± 13.66* | 221.79 ± 10.32** |
| 1 μM | 440.28 ± 23.13* | 167.59 ± 8.05*** |
| 2 μM | 405.72 ± 21.05** | 154.90 ± 13.63*** |
| 4 μM | 399.87 ± 6.94*** | 99.59 ± 16.38*** |
| 8 μM | 102.74 ± 10.62*** | 67.97 ± 3.86*** |
IC20, IC50 and IC80 values of masitinib in CMT-U27 and CMT-U309 cells as measured by the MTT assay
| Cell line | Treatment | Time | IC20 (μM) | IC50 (μM) | IC80 (μM) |
|---|---|---|---|---|---|
| 24 h | 2.00 | 9.129 | 41.668 | ||
| CMT-U27 | Masitinib | 48 h | 3.099 | 7.607 | 18.670 |
| 72 h | 2.868 | 7.498 | 19.60 | ||
| 24 h | 2.497 | 15.032 | 90.485 | ||
| CMT-U309 | Masitinib | 48 h | 3.097 | 8.871 | 25.405 |
| 72 h | 2.471 | 8.545 | 29.544 | ||