
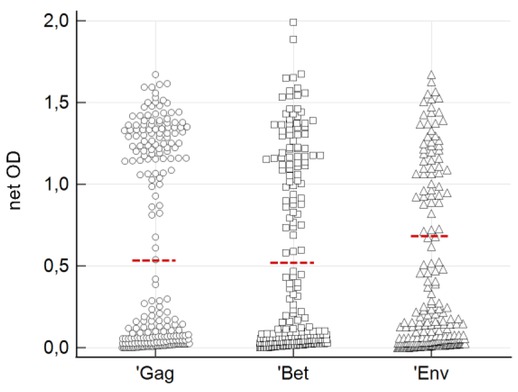
Fig. 1
Distribution of feline foamy virus Gag, Bet and Env antigens seroreactivity in 223 domestic cats from Poland. Dashed red lines indicate determined cut-off values
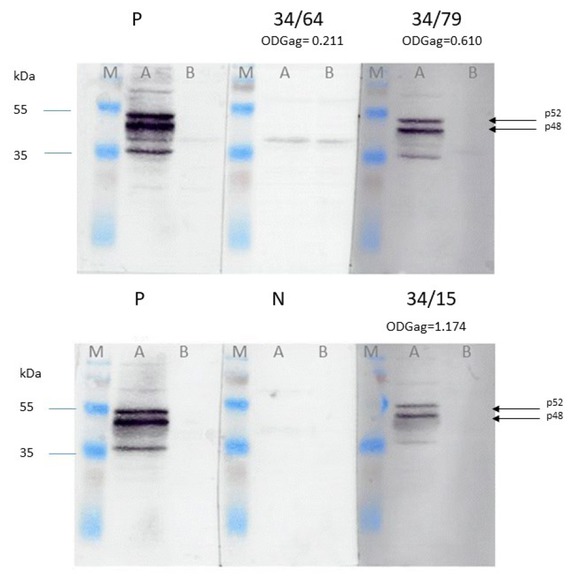
Fig. 2
Detection of FFVfca-specific antibodies by immunoblotting assays with a cellular antigen in representative feline serum samples. M – prestained protein ladder; A – lane with Crandell-Rees feline kidney cells (CRFK)/FFVfca cells lysate as antigen; B – lane with uninfected CRFK cells lysate as antigen; P – FFVfca positive control serum; N – FFVfca negative control serum; 34/64, 34/79, 34/15 – representative samples with their ELISA reactivity to FFVfca Gag antigen (OD Gag)
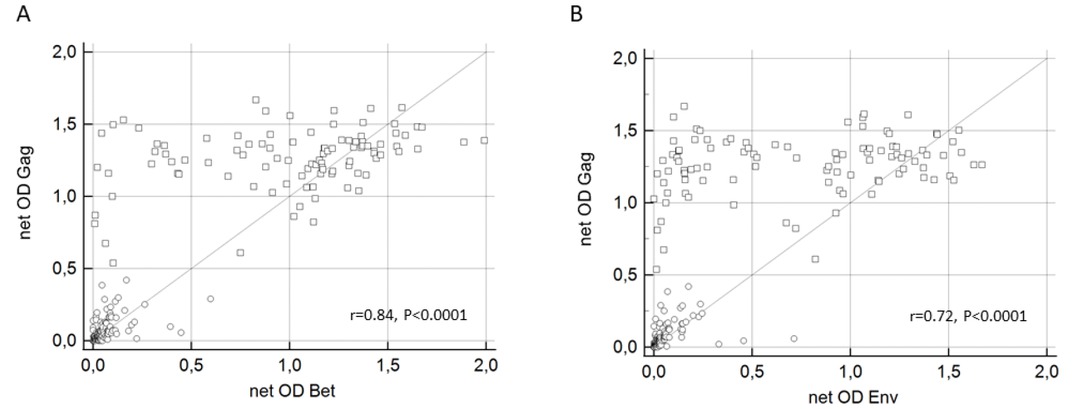
Fig 3
Scatter plot of ELISA results showing relationship between (A) feline foamy virus Gag and Bet and (B) Gag and Env antigens; correlation coefficients are indicated on both graphs. Circles indicate Gag ELISA negative and squares Gag ELISA positive samples
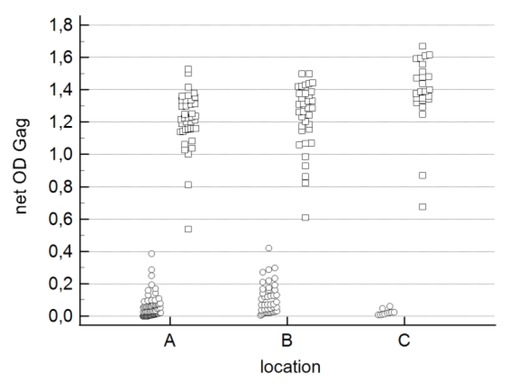
Fig. 4
Distribution of the cat serum samples’ reactivity to feline foamy virus Gag antigen by animal origin. Black circles indicate Gag ELISA-negative and grey squares Gag ELISA-positive samples; A – Warsaw; B– Gdańsk; C– Kraków agglomerations
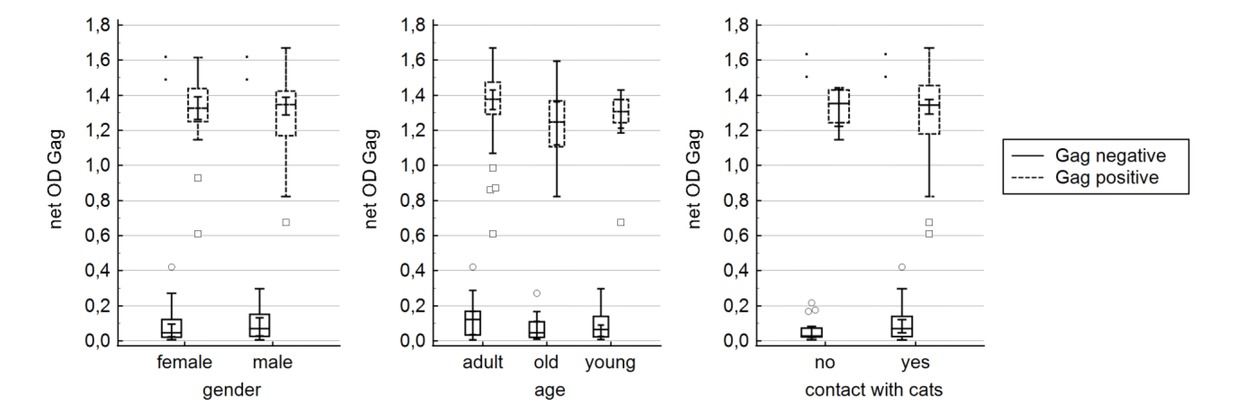
Fig. 5
Box-plot distribution of feline foamy virus Gag-seropositive and -seronegative cat samples from the Gdańsk and Kraków agglomerations analysed by variables
Table 1
Serological prevalence of FFVfca in domestic cat populations from the Gdańsk and Kraków agglomerations aligned with demographic variables
| Variable | Number of cats | ||
|---|---|---|---|
| FFVfca seropositive | Total | ||
| Gender | Female | 22 | 51 |
| Male | 37 | 61 | |
| Age | Young (≤1 year) | 10 | 22 |
| Adult (1–10 years) | 33 | 49 | |
| Old (>10years) | 16 | 29 | |
| Contact with other cats | Yes | 48 | 86 |
| No | 10 | 23 | |