
Fig. 1
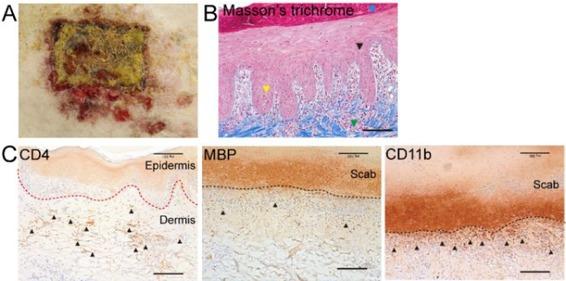
Fig. 2
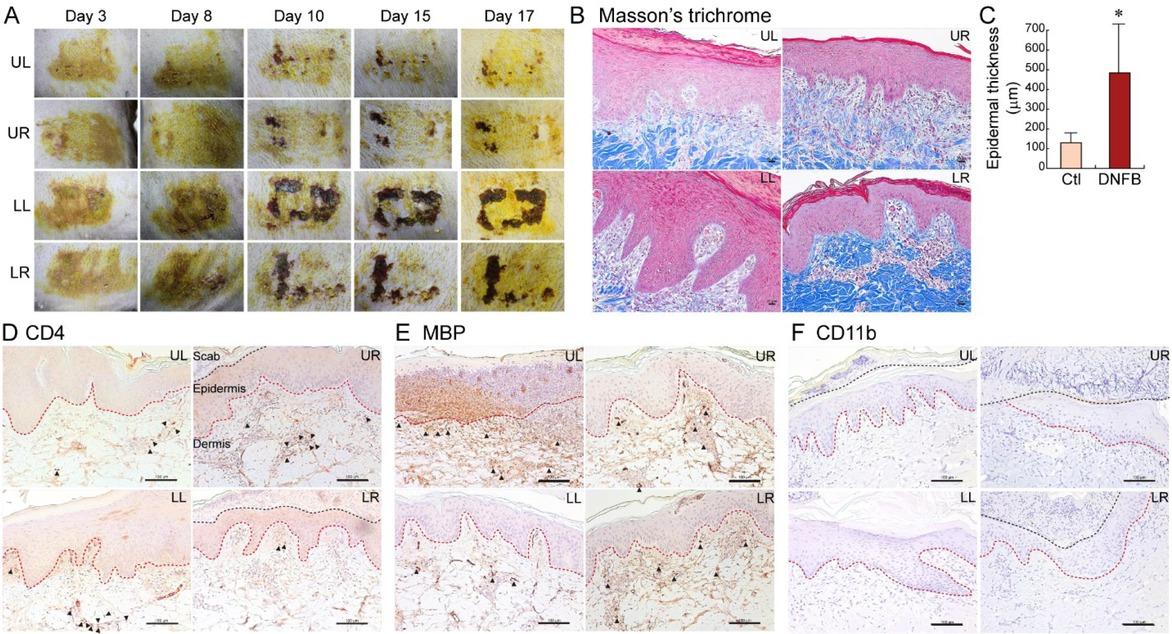
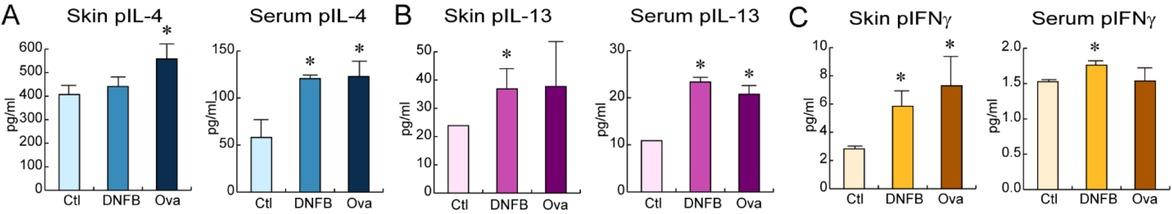
Fig. 3
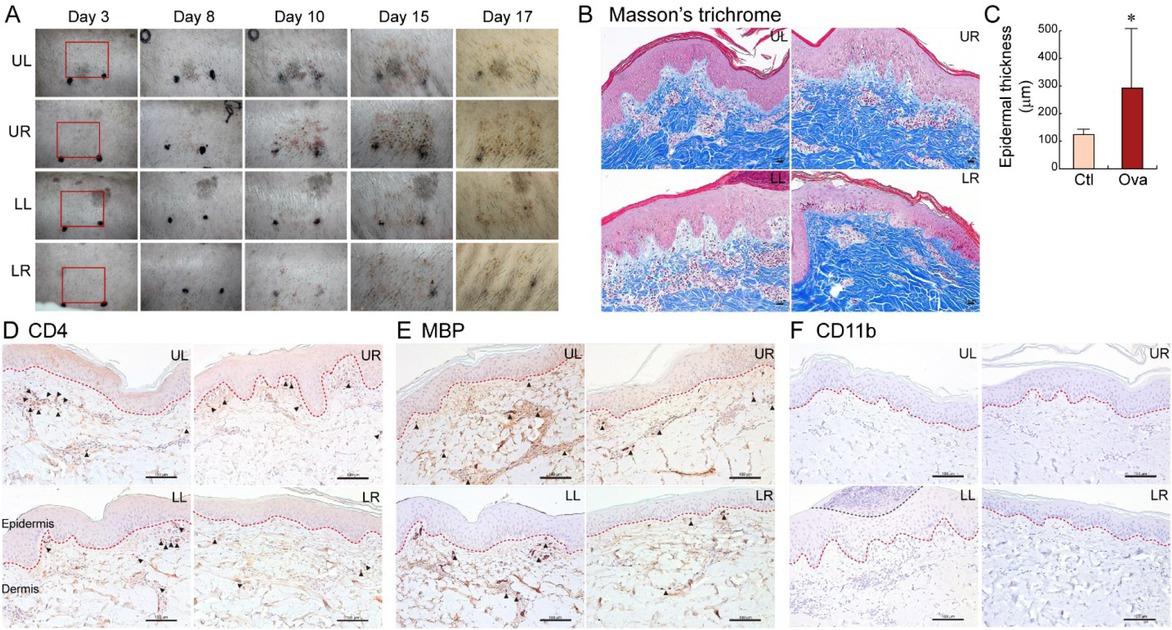
Fig. 4
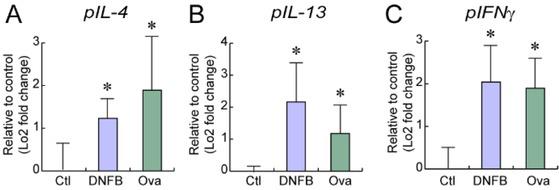
Fig. 5
Primers used for quantitative real-time PCR
| Gene symbol | Primer sequences (from 5ʹ to 3ʹ) | Length | GenBank accession number |
|---|---|---|---|
| IL-4 | F: GTCTGCTTACTGGCATGTACCA | 118 | NM214123.1 |
| R: GCTCCATGCACGAGTTCTTTCT | |||
| IFNγ | F: CGATCCTAAAGGACTATTTTAATGCAA | 102 | NM213948.1 |
| R: TTTTGTCACTCTCCTCTTTCCAAT | |||
| IL-13 | F: GGATGATTTTTCGCCACGGG | 78 | NM213803.1 |
| R: ATGGTAAAGGGCTGCCTCTG | |||
| GAPDH | F: ACAGACAGCCGTGTGTTCC | 60 | NM001206359.1 |
| R: ACCTTCACCATCGTGTCTCA |