
Table 1
Escape latencies in the Morris water maze test in all groups of rats at 1 month after 2-VO surgery (seconds)
| Group | N | Day 1 | Day 2 | Day 3 | Day 4 | Day 5 |
|---|---|---|---|---|---|---|
| Sham | 12 | 91.18 ± 5.87 | 52.32 ± 6.03 | 33.38 ± 5.67 | 20.09 ± 4.83 | 22.34 ± 2.1 |
| Model | 12 | 93.2 ± 8.53 | 53.62 ± 6.04 | 34.58 ± 5.61 | 20.89 ± 4.98 | 24.26 ± 4.56 |
| Lut 50 | 13 | 100.9 ± 5.65 | 55.26 ± 5.52 | 32.75 ± 5.49 | 30.63 ± 3.08 | 24.71 ± 4.98 |
| Lut 100 | 12 | 94.35 ± 5.99 | 60.45 ± 2.76 | 37.57 ± 6.13 | 26.48 ± 6.15 | 23.08 ± 3.36 |
| Nimodipine | 12 | 105.4 ± 5.49 | 64.91 ± 3.4 | 39.98 ± 9.33 | 24.78 ± 6.65 | 25.28 ± 4.94 |
[i] Data are expressed as mean ± SEM
Sham – group subjected to sham two-vessel occlusion surgery; Model – group subjected to two-vessel occlusion surgery without drug treatment; Lut 50 – group subjected to two-vessel occlusion surgery and administered luteolin at 50 mg/kg b.w.; Lut 100 – group subjected to two-vessel occlusion surgery and administered luteolin at 100 mg/kg b.w.; Nimodipine – group subjected to two-vessel occlusion surgery and administered nimodipine at 16 mg/kg b.w.
Table 2
Escape latencies in the Morris water maze test in all groups of rats at 3 months after 2-VO surgery (seconds)
| Group | N | Day 1 | Day 2 | Day 3 | Day 4 | Day 5 |
|---|---|---|---|---|---|---|
| Sham | 12 | 19.6 ± 5.85 | 10.08 ± 4.81 | 9.367 ± 4.51 | 8.49 ± 4.34 | 6.21 ± 2.22 |
| Model | 12 | 44.34 ± 5.88 | 37.96 ± 5.59## | 27.61 ± 5.55## | 35.3 ± 5.40## | 37.37 ± 6.07## |
| Lut 50 | 13 | 20.6 ± 5.40 | 8.553 ± 4.16** | 7.66 ± 3.52** | 6.93 ± 3.33** | 5.77 ± 2.36** |
| Lut 100 | 12 | 26.76 ± 5.84 | 10.76 ± 4.56** | 10.18 ± 4.77** | 9.89 ± 5.07** | 6.52 ± 3.02** |
| Nimodipine | 12 | 56.24 ± 5.76 | 35.33 ± 5.60 | 35.52 ± 5.82 | 29.72 ± 7.65 | 34.48 ± 5.85 |
[i] Data are expressed as mean ± SEM. Sham – group subjected to sham two-vessel occlusion surgery; Model – group subjected to two-vessel occlusion surgery without drug treatment; Lut 50 – group subjected to two-vessel occlusion surgery and administered luteolin at 50 mg/kg b.w.; Lut 100 – group subjected to two-vessel occlusion surgery and administered luteolin at 100 mg/kg b.w.; Nimodipine – group subjected to two-vessel occlusion surgery and administered nimodipine at 16 mg/kg b.w.
Table 3
Swimming speed of rats on the fifth day in the Morris water maze test (cm/s)
| Group | N | 1 month after 2-VO | 3 months after 2-VO |
|---|---|---|---|
| Sham | 12 | 14.25 ± 4.71 | 16.64 ± 5.70 |
| Model | 12 | 13.12 ± 3.26 | 15.31 ± 5.46 |
| Lut 50 | 13 | 16.42 ± 5.09 | 17.18 ± 6.07 |
| Lut 100 | 12 | 15.07 ± 5.24 | 16.09 ± 5.93 |
| Nimodipine | 12 | 13.25 ± 3.87 | 16.21 ± 6.01 |
[i] Data are expressed as mean ± SEM
Sham – group subjected to sham two-vessel occlusion surgery; Model – group subjected to two-vessel occlusion surgery without drug treatment; Lut 50 – group subjected to two-vessel occlusion surgery and administered luteolin at 50 mg/kg b.w.; Lut 100 – group subjected to two-vessel occlusion surgery and administered luteolin at 100 mg/kg b.w.; Nimodipine – group subjected to two-vessel occlusion surgery and administered nimodipine at 16 mg/kg b.w.
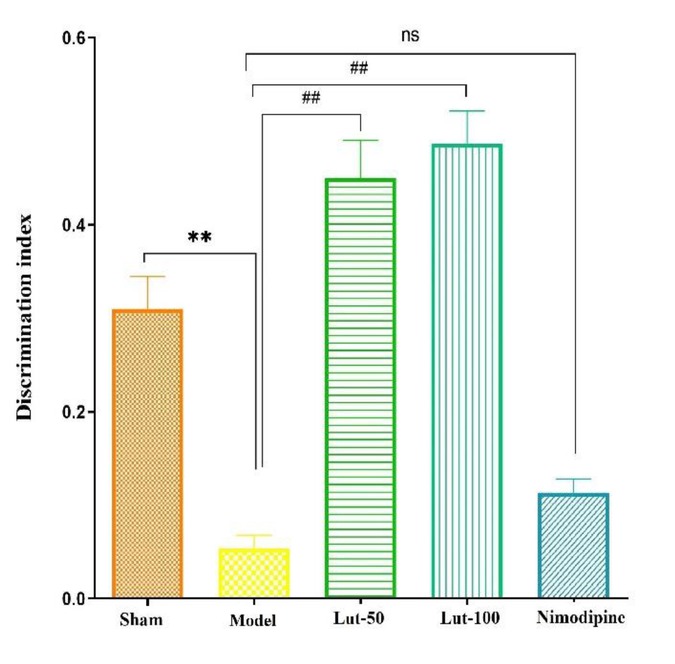
Fig. 1a
Effects of luteolin on learning and memory impairment in 2-VO rats evaluated by the object recognition test one month after 2-VO surgery. Discrimination index was measured at one month after 2-VO surgery. Data are expressed as mean ± SEM. n = 15 in each group
Sham – group subjected to sham two-vessel occlusion surgery; Model – group subjected to two-vessel occlusion surgery without drug treatment; Lut 50 – group subjected to two-vessel occlusion surgery and administered luteolin at 50 mg/kg b.w.; Lut 100 – group subjected to two-vessel occlusion surgery and administered luteolin at 100 mg/kg b.w.; Nimodipine – group subjected to two-vessel occlusion surgery and administered nimodipine at 16 mg/kg b.w.; ** – P < 0.01, model group vs. sham group; ## – P < 0.01, luteolintreated groups vs. model group; ns – non-significant
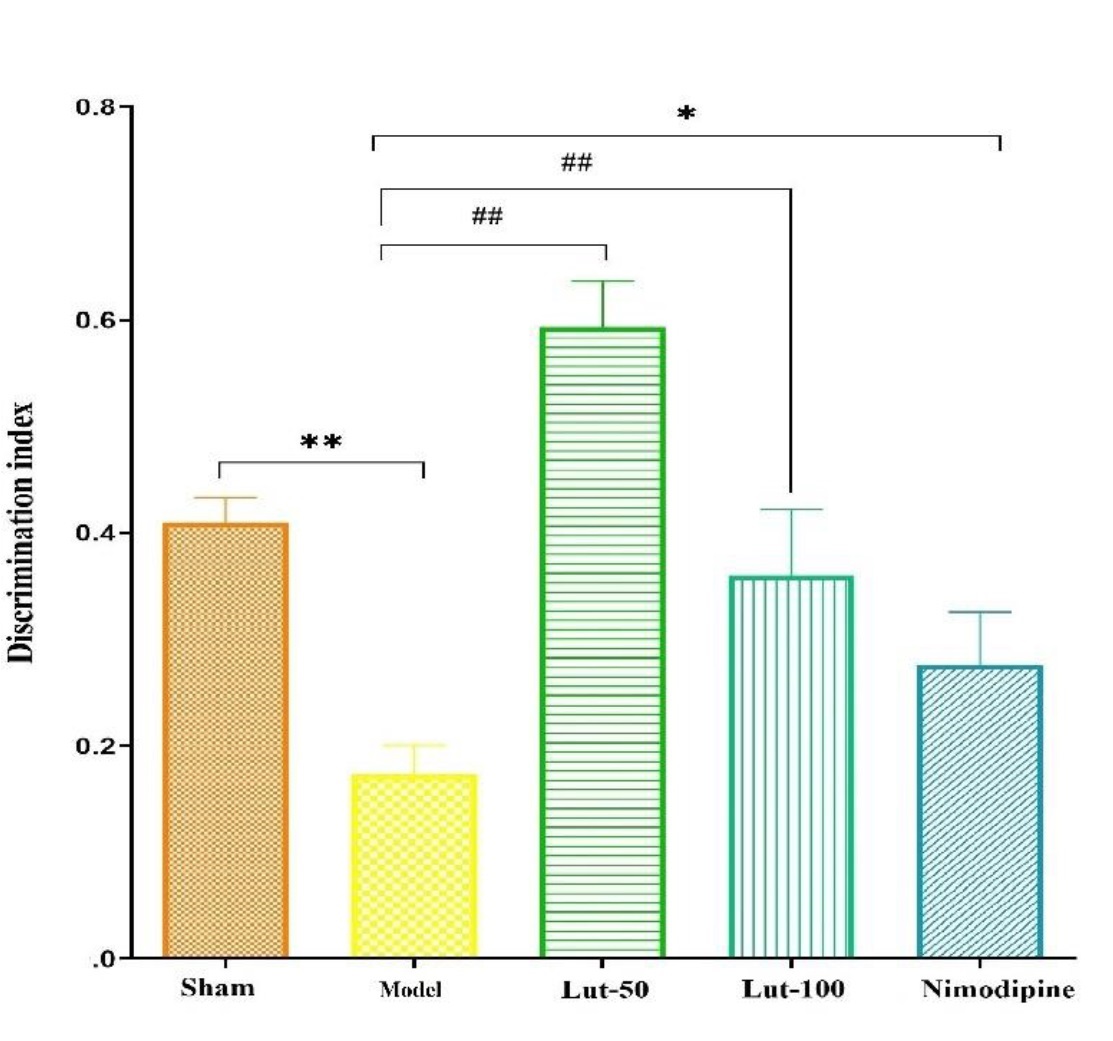
Fig. 1b
Effects of luteolin on learning and memory impairment in 2-VO rats evaluated by the object recognition test three months after 2-VO surgery. Discrimination index was measured at three months after 2-VO surgery. Data are expressed as mean ± SEM. n = 15 in each group
Sham – group subjected to sham two-vessel occlusion surgery; Model – group subjected to two-vessel occlusion surgery without drug treatment; Lut 50 – group subjected to two-vessel occlusion surgery and administered luteolin at 50 mg/kg b.w.; Lut 100 – group subjected to two-vessel occlusion surgery and administered luteolin at 100 mg/kg b.w.; Nimodipine – group subjected to two-vessel occlusion surgery and administered nimodipine at 16 mg/kg b.w.; *– P < 0.05;** – P < 0.01, model group vs. sham group; * –P < 0.05, all three treatment groups vs. model group; ## –P < 0.01, luteolin-treated groups vs. model group
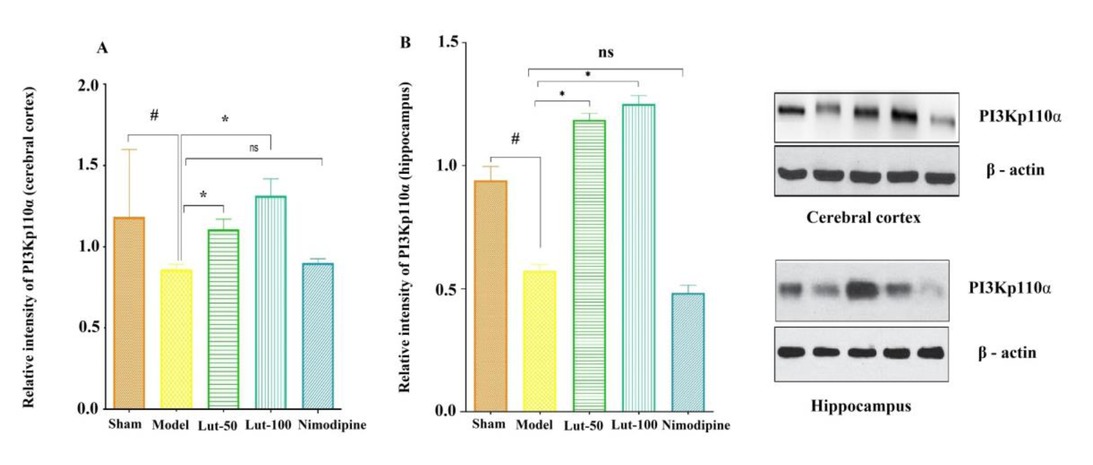
Fig. 2
Effects of luteolin on the PI3K/Akt pathway in the cerebral cortex (A) and hippocampus (B) of 2-VO rats shown in the relative intensity of PI3K subunits of p110α and representative Western blot images of important factors in the PI3K pathway three months after 2-VO surgery. Data are expressed as mean ± SEM. n = 4 in each group
Sham – group subjected to sham two-vessel occlusion surgery; Model – group subjected to two-vessel occlusion surgery without drug treatment; Lut 50 – group subjected to two-vessel occlusion surgery and administered luteolin at 50 mg/kg b.w.; Lut 100 – group subjected to two-vessel occlusion surgery and administered luteolin at 100 mg/kg b.w.; Nimodipine – group subjected to two-vessel occlusion surgery and administered nimodipine at 16 mg/kg b.w.; PI3K – phosphatidylinositol 3-kinase; β-actin – total protein amount normaliser; # – P < 0.05, model group vs. sham group; * – P < 0.05, luteolin-treated groups vs. model group; ns – non-significant
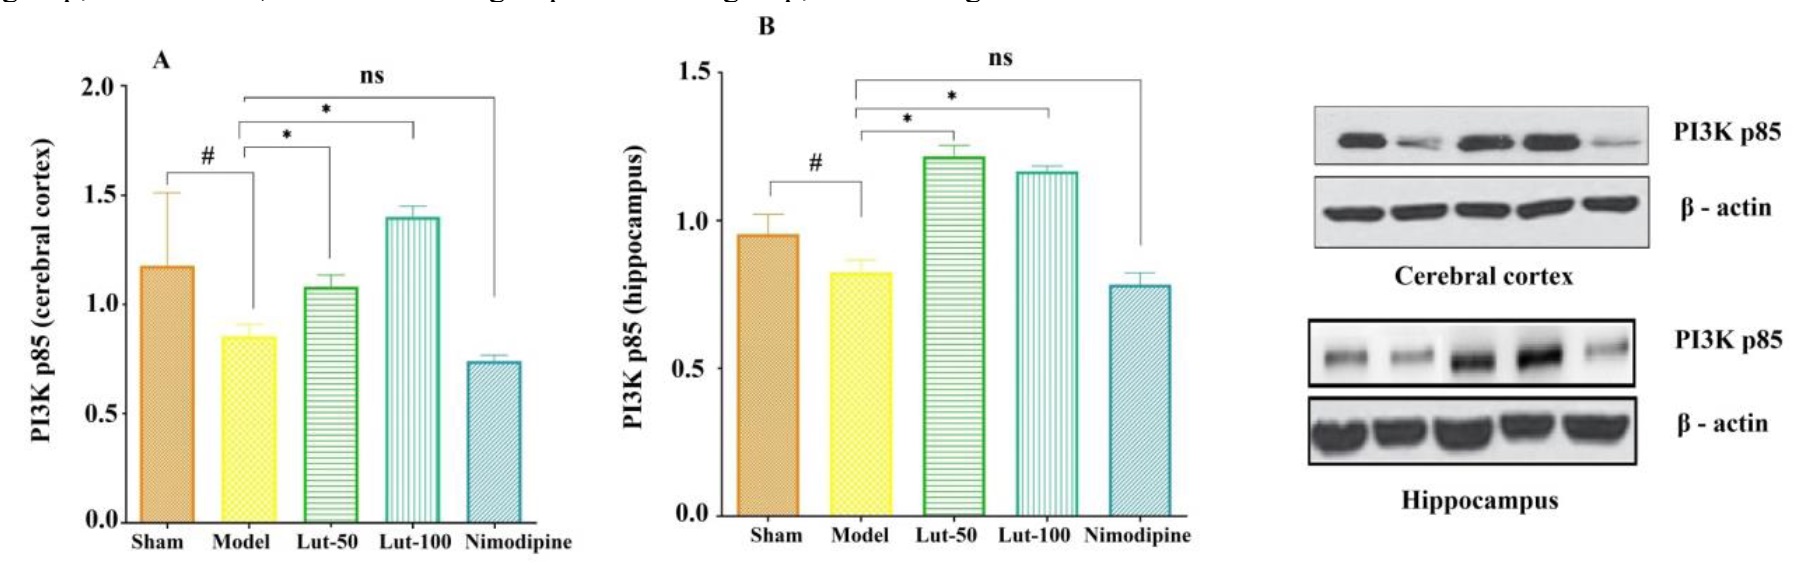
Fig. 3
Effects of Luteolin on the PI3K/Akt pathway in the cerebral cortex (A) and hippocampus (B) of 2-VO rats shown as the relative intensity of PI3K subunits of p85 and representative Western blot images of important factors in the PI3K pathway three months after 2-VO surgery. Data are expressed as mean ± SEM. n = 3 in each group
Sham – group subjected to sham two-vessel occlusion surgery; Model – group subjected to two-vessel occlusion surgery without drug treatment; Lut 50 – group subjected to two-vessel occlusion surgery and administered luteolin at 50 mg/kg b.w.; Lut 100 – group subjected to two-vessel occlusion surgery and administered luteolin at 100 mg/kg b.w.; Nimodipine– group subjected to two-vessel occlusion surgery and administered nimodipine at 16 mg/kg b.w.; PI3K – phosphatidylinositol 3-kinase; β-actin – total protein amount normaliser;# – P < 0.05, model group vs. sham group; * – P < 0.05, luteolin-treated groups vs. model group; ns – non-significant
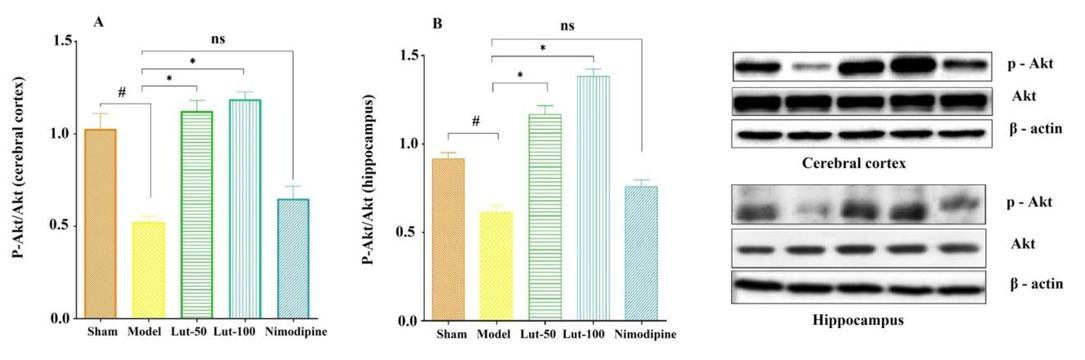
Fig. 4
Effects of luteolin on the P-Akt/Akt pathway in the cerebral cortex (A) and hippocampus (B) of 2-VO rats shown as the relative intensity of P-Akt and total Akt and representative Western blot images of important factors in the Akt pathway three months after 2-VO surgery. Data are expressed as mean ± SEM. n = 3 in each group
Sham – group subjected to sham two-vessel occlusion surgery; Model – group subjected to two-vessel occlusion surgery without drug treatment; Lut 50 – group subjected to two-vessel occlusion surgery and administered luteolin at 50 mg/kg b.w.; Lut 100 – group subjected to two-vessel occlusion surgery and administered luteolin at 100 mg/kg b.w.; Nimodipine – group subjected to two-vessel occlusion surgery and administered nimodipine at 16 mg/kg b.w.; P-Akt – phosphorylated protein kinase B; Akt – protein kinase B; β-actin – total protein amount normaliser; # – P < 0.05, model group vs. sham group; * – P < 0.05, luteolin-treated groups vs. model group; ns – non-significant