
Table 1
Clinical data from the two groups of cows
| Parameter | PEB (n = 15) | NEB (n = 15) | P value |
|---|---|---|---|
| Age | 3.49 ± 0.35 | 3.45 ± 0.38 | 0.942 |
| Parity | 2.47 ± 0.32 | 2.20 ± 0.33 | 0.565 |
| 14–21 d BCS | 3.18 ± 0.09 | 3.38 ± 0.07 | 0.094 |
| 50–55 d BCS | 2.97 ± 0.09 | 2.88 ± 0.09 | 0.522 |
| ΔBCS | 0.22 ± 0.01 | 0.50 ± 0.08 | 0.025 |
| MY (kg/d) | 42.32 ± 1.36 | 36.76 ± 1.46 | 0.010 |
Table 2
Least squares means ± SEM of the largest follicle diameter on days 50 and 55 and the growth rate between days 50 and 55 in Holstein cows
| Parameter | PEB (n = 15) | NEB (n = 15) | P value |
|---|---|---|---|
| LF diameter on d 50 (mm) | 6.53 ± 0.97 | 7.07 ± 0.90 | 0.690 |
| LF diameter on d 55 (mm) | 12.27 ± 0.66 | 10.53 ± 0.93 | 0.138 |
| Growth rate of the LF (mm/d) | 1.19 ± 0.13 | 0.68 ± 0.11 | 0.007 |
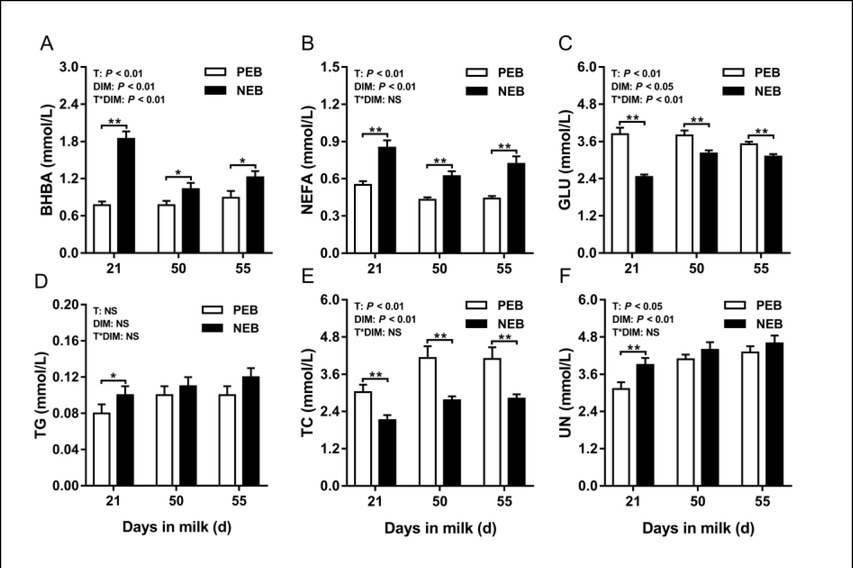
Fig. 1
Least squares mean (± SEM) concentrations of plasma β-hydroxybutyric acid, non-esterified fatty acids, glucose, triglycerides, total cholesterol, and urea nitrogen at 21, 50, and 55 d after calving for positive energy balance (PEB) (n = 15) and negative energy balance (NEB) (n = 15) dairy cows
T – treatment group; DIM – days in milk; T × DIM – interaction between treatment group and days in milk
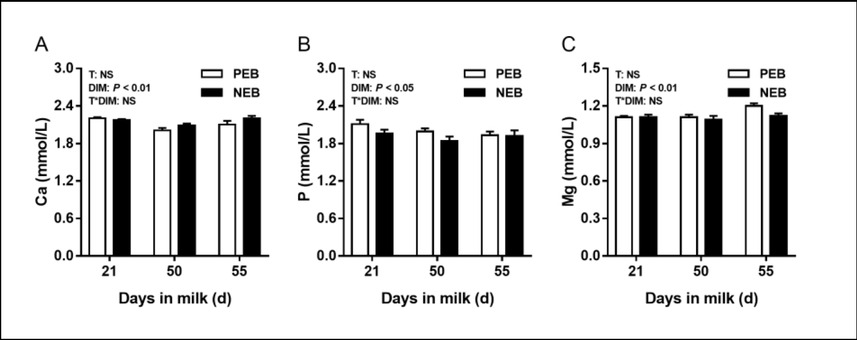
Fig. 2
Least squares mean (± SEM) concentrations of plasma Ca, P, and Mg at 21, 50, and 55 d after calving for positive energy balance (PEB) (n = 15) and negative energy balance (NEB) (n = 15) dairy cows
T – treatment group; DIM – days in milk; T × DIM – interaction between treatment group and days in milk
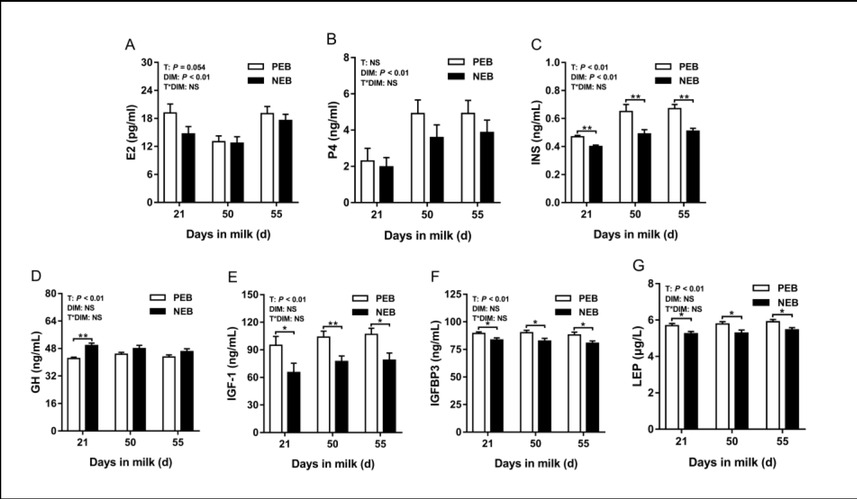
Fig. 3
Least squares mean (± SEM) concentrations of plasma E2, P4, INS, GH, IGF-1, IGFBP3, and LEP at 21, 50, and 55 d after calving for positive energy balance (PEB) (n = 15) and negative energy balance (NEB) (n = 15) dairy cows
T – treatment group; DIM – days in milk; T × DIM – interaction between treatment group and days in milk
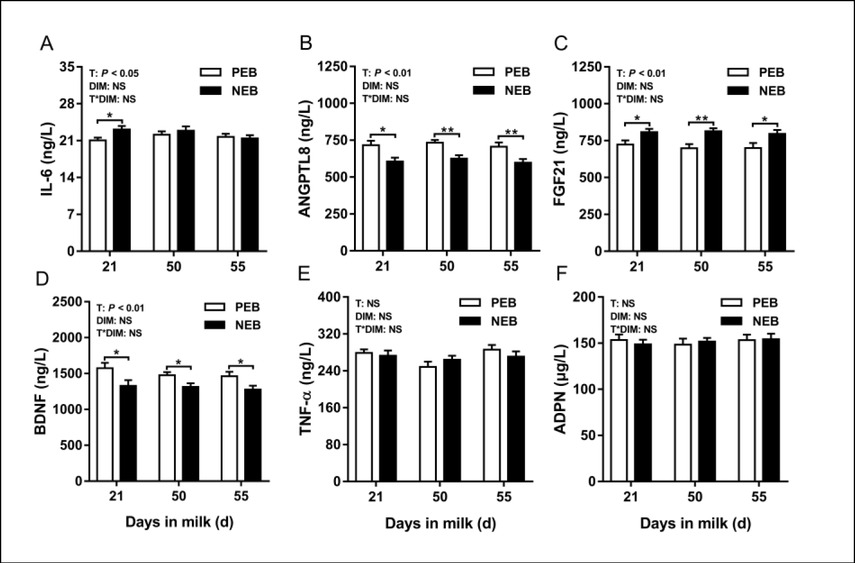
Fig. 4
Least squares mean (± SEM) concentrations of plasma IL-6, ANGPTL8, FGF21, BDNF, TNF-α, and ADPN at 21, 50, and 55 d after calving for positive energy balance (PEB) (n = 15) and negative energy balance (NEB) (n = 15) dairy cows
T – treatment group; DIM – days in milk; T × DIM – interaction between treatment group and days in milk