
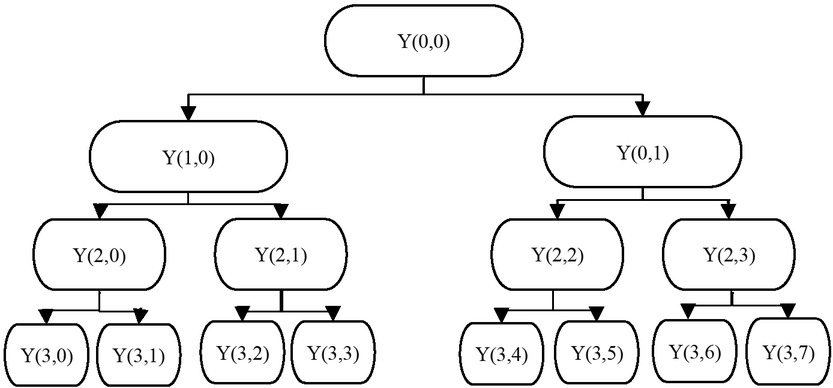
Fig. 1
Hierarchical Structure of WPD
Table 1
Situation of H7N9 avian influenza epidemic from April 2013 to April 2020
| Time | Province | Number of outbreaks | Poultry | Number of cases | Number of fatalities | Number of animals culled |
|---|---|---|---|---|---|---|
| June 2017 | Inner Mongolia | 2 | Chicken | 63,406 | 37,582 | 424,197 |
| June 2017 | Heilongjiang | 1 | Chicken | 20,150 | 19,500 | 16,610 |
| August 2017 | Anhui | 1 | Chicken | 1,368 | 910 | 74,463 |
| March 2018 | Shaanxi | 1 | Chicken | 1,000 | 810 | 1,000 |
| April 2018 | Shanxi | 1 | Chicken | 812 | 699 | 6,374 |
| April 2018 | Ningxia | 1 | Chicken | 1,200 | 585 | 13,578 |
| May 2018 | Liaoning | 1 | Chicken | 11,000 | 9,000 | 8,000 |
| May 2018 | Ningxia | 1 | Chicken | 3,000 | 2,210 | 86,000 |
| March 2019 | Liaoning | 1 | Peacock | 9 | 9 | 191 |
Table 2
Spatial autocorrelation analysis of H7N9 avian influenza virus detections in China
| Variable | Moran’s I | Z score | P value |
|---|---|---|---|
| From 2013 to 2020 | −0.014 | 0.387 | 0.350 |
| In 2013 | −0.019 | 0.259 | 0.398 |
| In 2014 | −0.046 | −0.362 | 0.359 |
| In 2015 | 0.042 | 1.783 | 0.037 |
| In 2016 | −0.064 | −0.992 | 0.161 |
| In 2017 | −0.034 | −0.075 | 0.470 |
| In 2018 | −0.007 | 0.607 | 0.272 |
| In 2019 | −0.021 | 0.239 | 0.406 |
| In 2020 | — | — | — |
| In January | −0.008 | 0.507 | 0.306 |
| In February | −0.008 | 0.526 | 0.299 |
| In March | −0.006 | 0.563 | 0.287 |
| In April | −0.004 | 0.586 | 0.279 |
| In May | −0.040 | −0.210 | 0.417 |
| In June | −0.045 | −0.350 | 0.363 |
| In July | 0.009 | 1.103 | 0.135 |
| In August | — | — | — |
| In September | −0.073 | −0.996 | 0.160 |
| In October | −0.036 | −0.164 | 0.435 |
| In November | −0.046 | −0.366 | 0.357 |
| In December | 0.072 | 2.320 | 0.010 |
| Before comprehensive animal H7N9 immunisation | −0.020 | 0.255 | 0.399 |
| After comprehensive animal H7N9 immunisation | −0.028 | 0.058 | 0.477 |
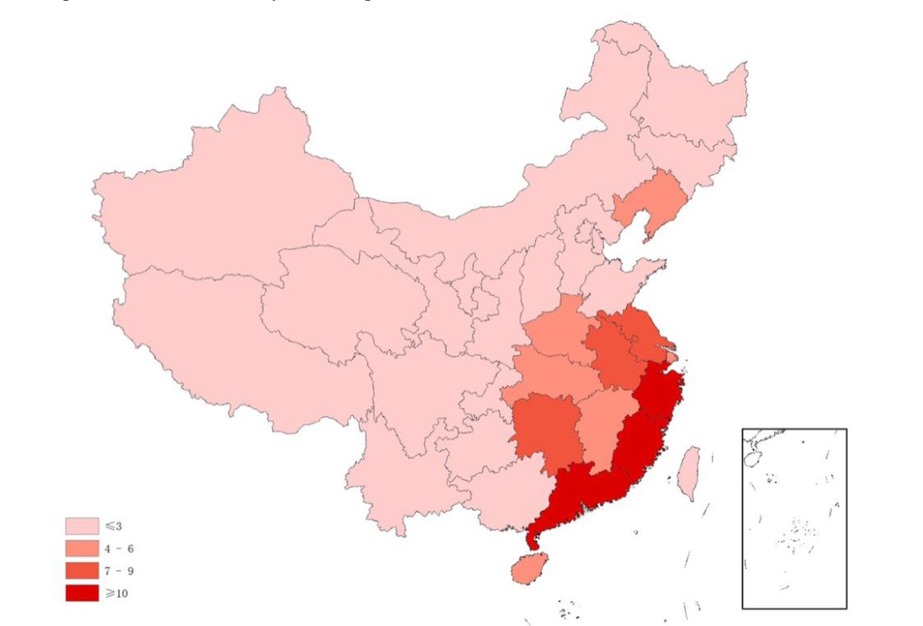
Fig. 2
Regional distribution of H7N9 avian influenza virus detections in China
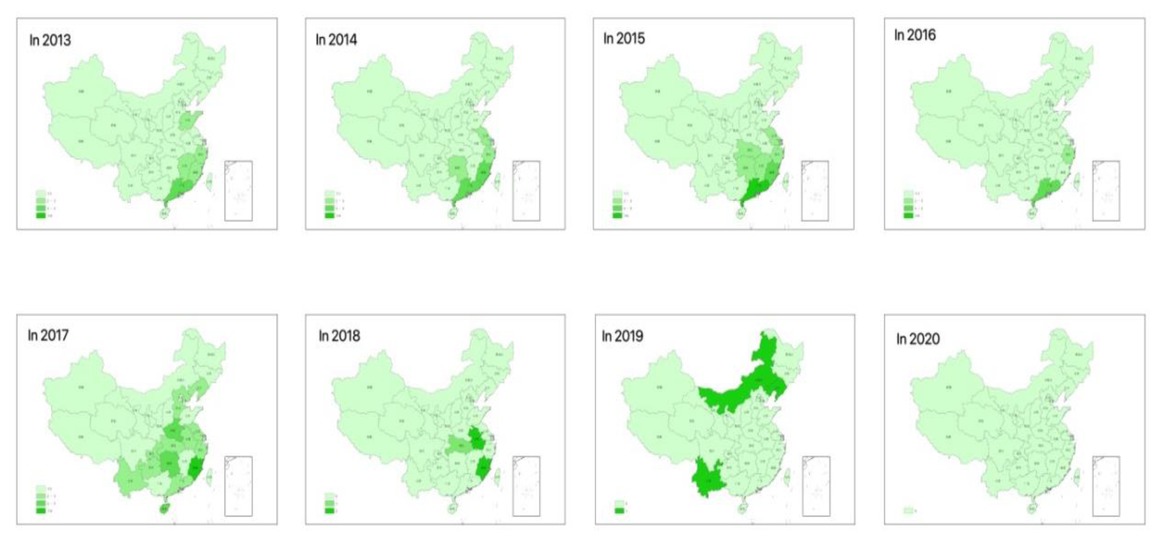
Fig. 3
Regional distribution of H7N9 avian influenza virus in China from 2013 to 2020
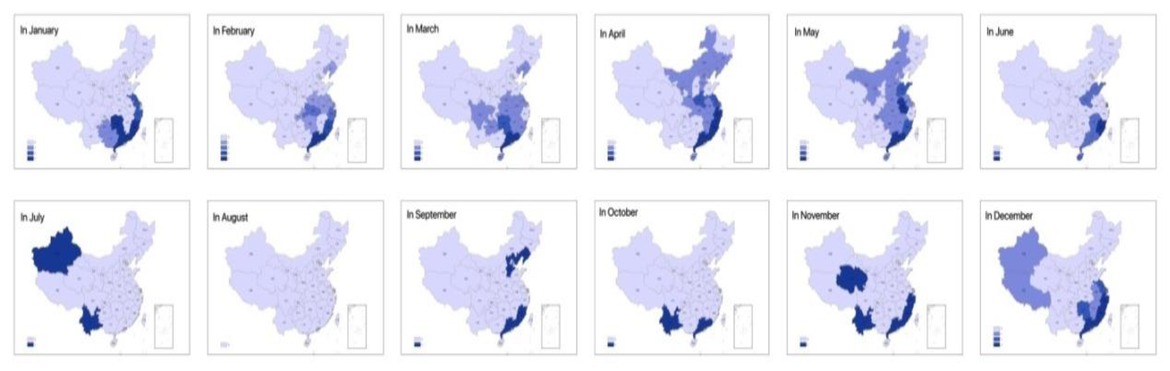
Fig. 4
Regional distribution of cumulative H7N9 avian influenza virus detections in China from January to December between 2013 and 2020
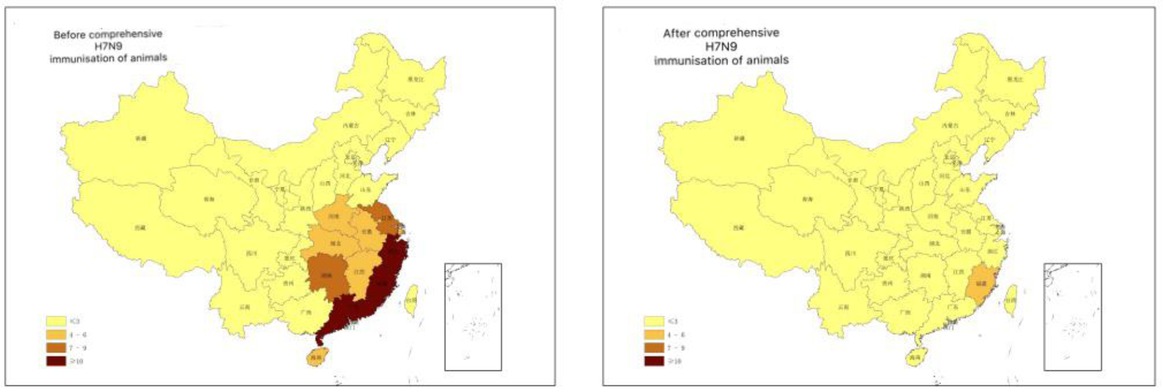
Fig. 5
Regional distribution of H7N9 avian influenza virus detections before and after comprehensive H7N9 immunisation of at-risk animals in China
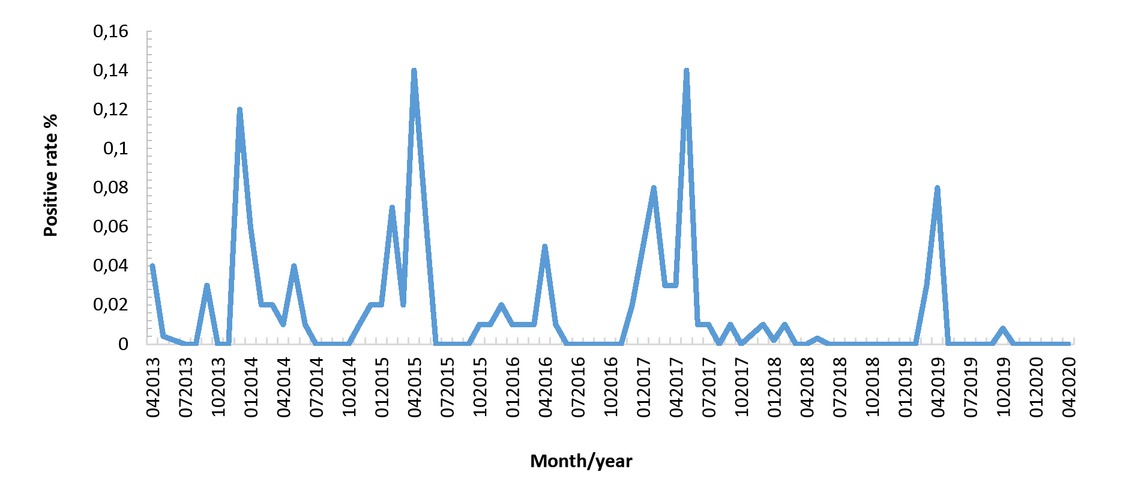
Fig. 6
Temporal distribution of positive rate of animal H7N9 avian influenza virus detections in China from 2013 to 2020
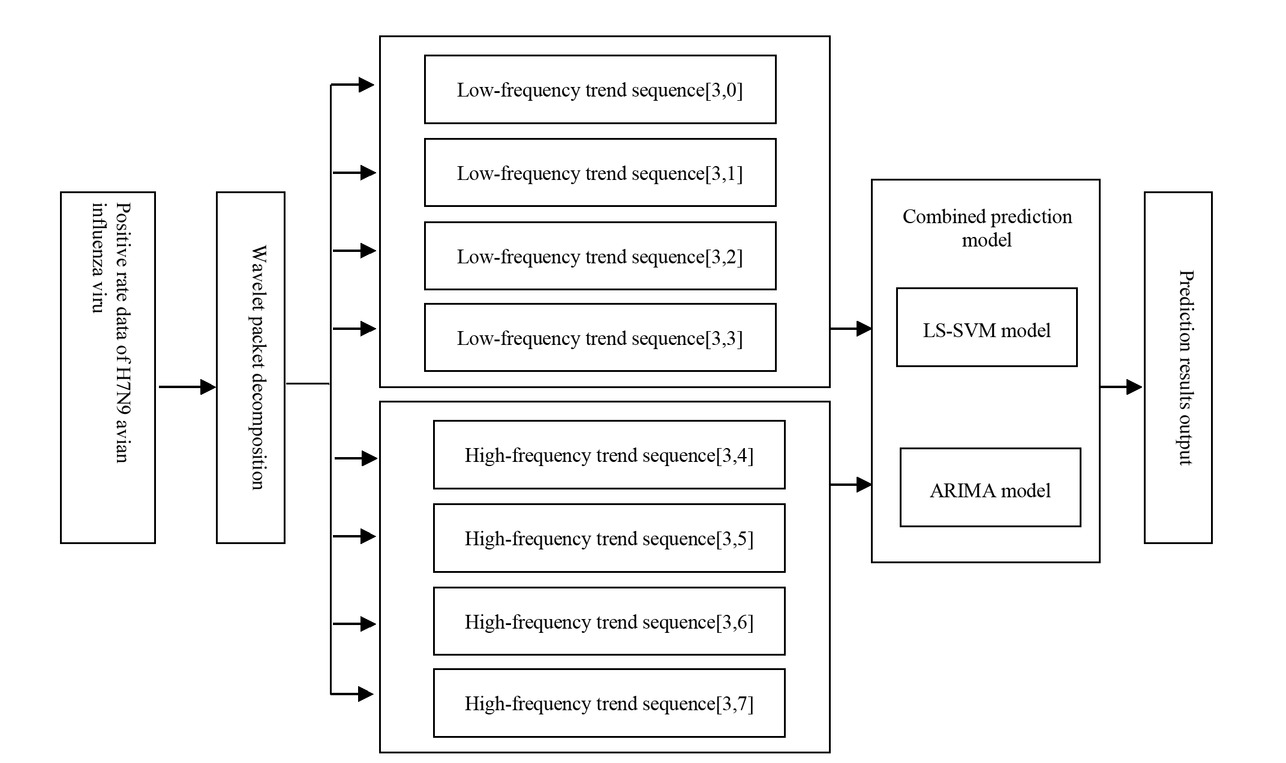
Fig. 7
Steps for constructing the LS-SVM-ARIMA combined model based on WPD
LS-SVM – least squares support-vector machines; ARIMA – autoregressive integrated moving average
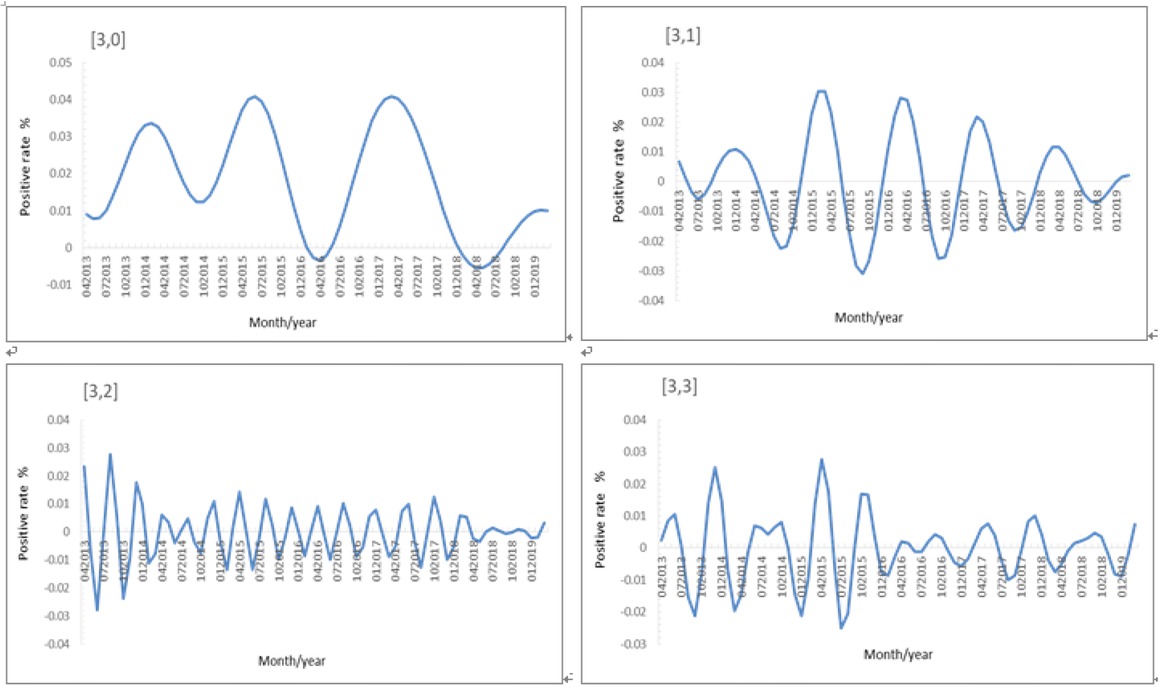
Fig. 8
Low-frequency trend sequence decomposition of positive rates of H7N9 avian influenza virus from April 2013 to April 2019
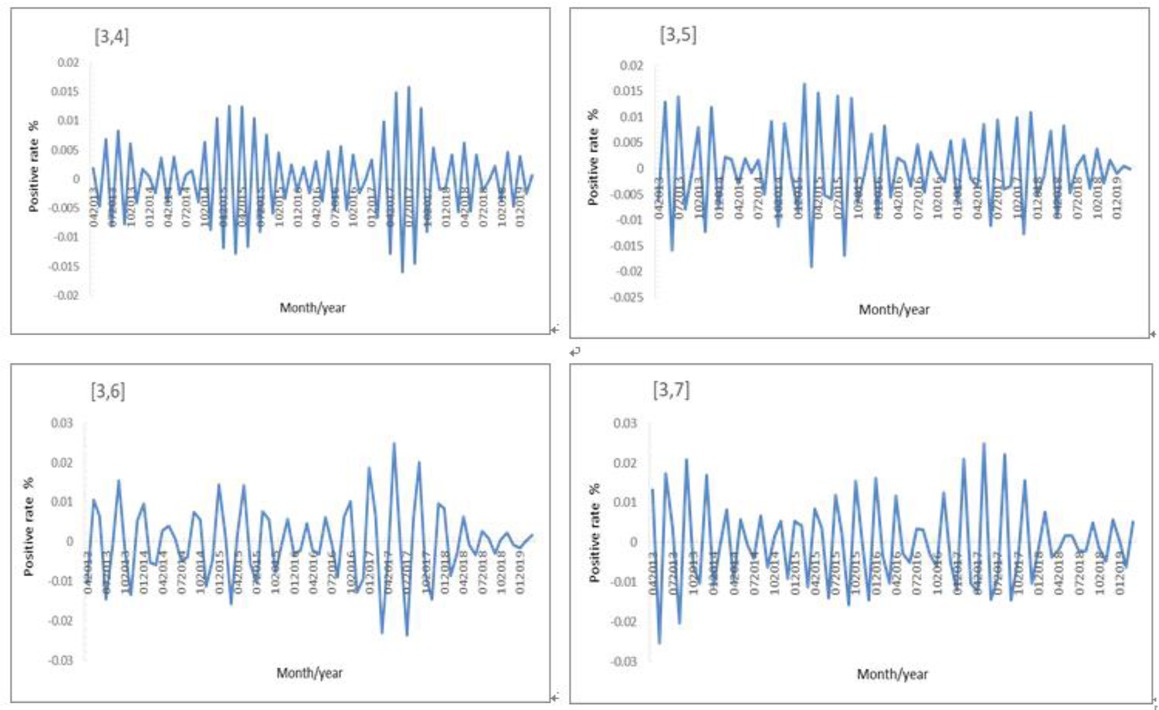
Fig. 9
High-frequency trend sequence decomposition of positive rates of H7N9 avian influenza virus detections from April 2013 to April 2019
Table 3
Optimisation results of low-frequency trend sequence parameters
| Decomposition sequence | Hyperparameters σ | Normalisation parameters ɣ |
|---|---|---|
| [3,0] | 9506 | 7350.8 |
| [3,1] | 2514.5 | 3946.2 |
| [3,2] | 9113.6 | 9740.8 |
| [3,3] | 818.709 | 7242.1 |
Table 4
ARIMA model parameters
| Decomposition sequence | ARIMA model parameters |
|---|---|
| [3,4] | ARIMA (1,0,0)*(2,0,0) [12] |
| [3,5] | ARIMA (3,0,0) |
| [3,6] | ARIMA (0,0,0) |
| [3,7] | ARIMA (3,0,0) |
Table 5
Prediction results of the LS-SVM-ARIMA combined model based on WPD
| Date | Real value | [3,0] | [3,1] | [3,2] | [3,3] | [3,4] | [3,5] | [3,6] | [3,7] | Predictive value |
|---|---|---|---|---|---|---|---|---|---|---|
| 05/2019 | 0 | 0 | 0 | 0.001 | 0 | 0 | 0.001 | 0 | 0 | 0.002 |
| 06/2019 | 0 | 0 | 0 | 0 | 0 | 0 | 0 | 0 | 0.001 | 0.001 |
| 07/2019 | 0 | 0 | 0.001 | 0 | 0 | 0 | 0 | 0 | 0 | 0.001 |
| 08/2019 | 0 | 0.001 | 0 | 0 | 0.001 | 0.001 | 0 | 0 | 0 | 0.003 |
| 09/2019 | 0 | 0 | 0 | 0 | 0.001 | 0 | 0.001 | 0 | 0 | 0.002 |
| 10/2019 | 0.001 | 0.001 | 0.002 | 0.001 | 0.001 | 0.001 | 0.002 | 0 | 0.001 | 0.010 |
| 11/2019 | 0 | 0.001 | 0.001 | 0 | 0 | 0.001 | 0 | 0 | 0 | 0.003 |
| 12/2019 | 0 | 0.001 | 0 | 0.001 | 0.001 | 0 | 0.001 | 0 | 0.002 | 0.006 |
| 01/2020 | 0 | 0 | 0.001 | 0 | 0.001 | 0.001 | 0.001 | 0 | 0 | 0.004 |
| 02/2020 | 0 | 0.001 | 0 | 0 | 0 | 0.002 | 0 | 0 | 0 | 0.003 |
| 03/2020 | 0 | 0 | 0.001 | 0 | 0 | 0 | 0 | 0 | 0 | 0.001 |
| 04/2020 | 0 | 0 | 0.001 | 0 | 0 | 0.001 | 0 | 0 | 0 | 0.002 |
Table 6
Prediction results based on the three models: ARIMA, LS-SVM and ARIMA-LS-SVM
| Date | Real value | ARIMA model | LS-SVM model | LS-SVM-ARIMA model |
|---|---|---|---|---|
| 05/2019 | 0 | 0.014 | 0.013 | 0.009 |
| 06/2019 | 0 | 0.007 | 0.006 | 0.011 |
| 07/2019 | 0 | 0.004 | 0.005 | 0.016 |
| 08/2019 | 0 | 0.011 | 0.012 | 0.012 |
| 09/2019 | 0 | 0.009 | 0.008 | 0.008 |
| 10/2019 | 0.008 | 0.014 | 0.013 | 0.020 |
| 11/2019 | 0 | 0.017 | 0.010 | 0.008 |
| 12/2019 | 0 | 0.020 | 0.015 | 0.016 |
| 01/2020 | 0 | 0.005 | 0.006 | 0.007 |
| 02/2020 | 0 | 0.010 | 0.007 | 0.003 |
| 03/2020 | 0 | 0.011 | 0.005 | 0.005 |
| 04/2020 | 0 | 0.018 | 0.012 | 0.010 |
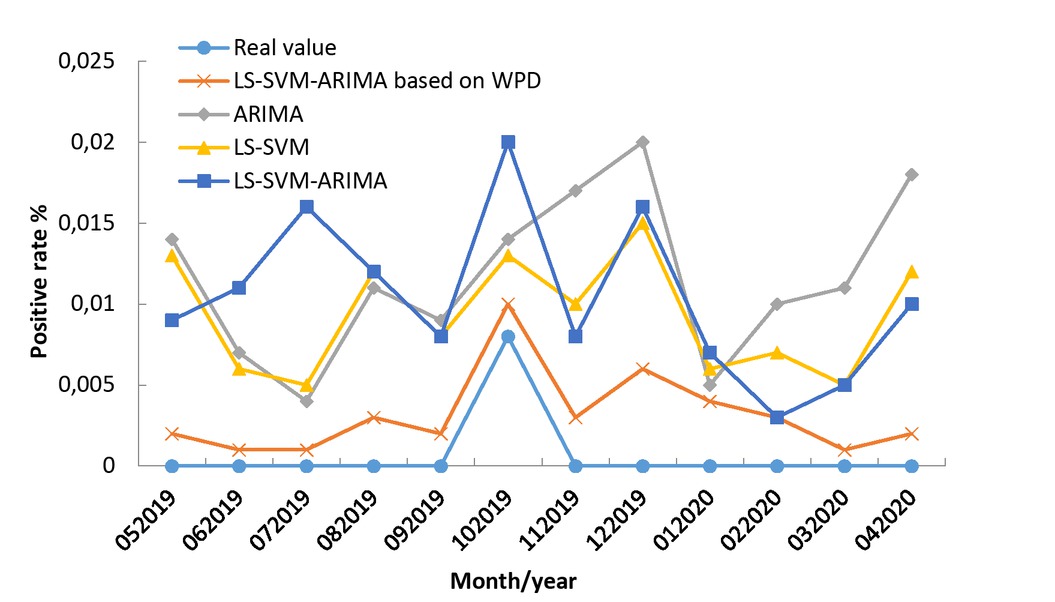
Fig. 10
Comparisons of predicted values from each model with the true values
LS-SVM – least square support-vector machines; WPD – wavelet packet decomposition; ARIMA – autoregressive integrated moving average