
Fig. 1
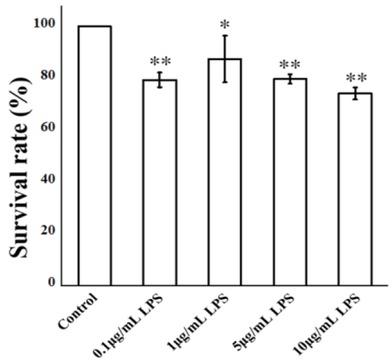
Fig. 2
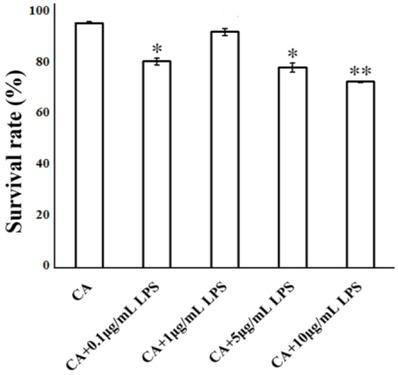
Fig. 3
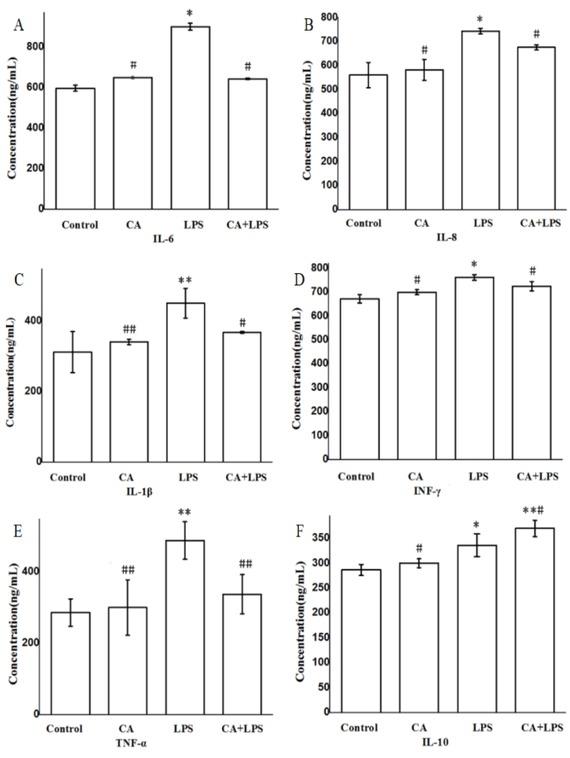
Fig. 4
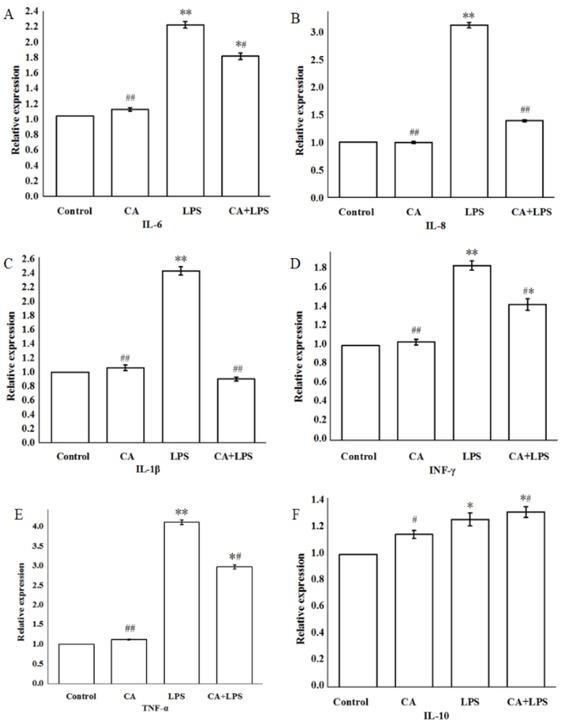
Fig. 5
Gene primer sequences
| Gene | Forward primer | Reverse primer |
|---|---|---|
| GAPDH | ATCTGACCTGCCGCCTGGAG | GACGCCTGCTTCACCACCTTC |
| INF-γ | CCGAGCGTGGAGGATCATTGC | CCAACGAGGCACAGCAGGATG |
| TNF-α | CTGGCGGAGGAGGTGCTCTC | GGAGGAAGGAGAAGAGGCTGAGG |
| IL-10 | ACCAGCCACCAATGTTGCTCATAC | CTTCTCCACCGCCTTGCTCTTG |
| IL-6 | CACTGACCTGCTGGAGAAGATGC | CCGAATAGCTCTCAGGCTGAACTG |
| IL-1β | GAGTGCCATCCTTCTGTCAAGTCC | AGCCTACCAAGCTCCTCCATCC |
| IL-8 | CATGGATGGAGGAGCCTGGTAGG | CTGCTAAGTCGCTTCAGTCGTGTC |
| NF-κB | ACAAGCCTGTCACAGCCAACATG | TGATGGTGAAGGCTCAGGAGGTG |
| IRF5 | TGCTGCCTCTGACCGACCTG | CGCACTTGCTCCAGGCTCAC |
| MyD88 | TATCGGCTGAAGTTGTGCGTGTC | TCAGAGACCACCACCACCATCC |