
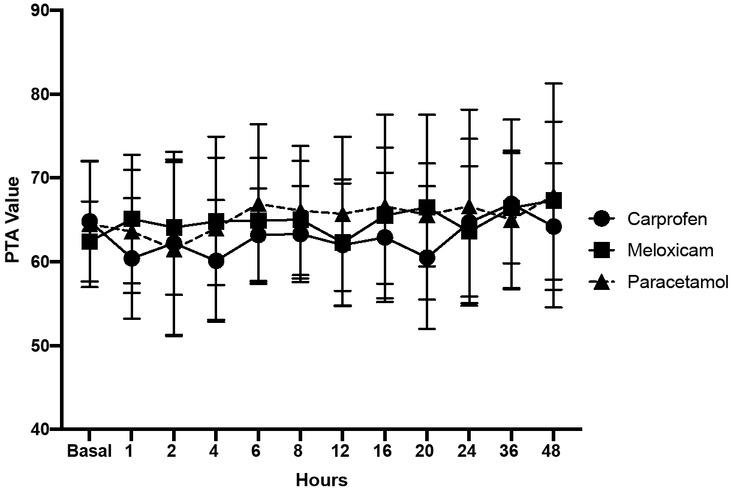
Fig. 1
Intrinsic diagnostic characteristics of the PTA index during the evaluation of postoperative analgaesia
| Percentage | |
|---|---|
| Sensitivity | 40% |
| Specificity | 98.46% |
| Negative predictive value | 99.07% |
UMPS scores during the postoperative period in GPARAC, GCARP, and GMELOX
| Postoperative period (hours) | |||||||||||
|---|---|---|---|---|---|---|---|---|---|---|---|
| 1 | 2 | 4 | 6 | 8 | 12 | 16 | 20 | 24 | 36 | 48 | |
| GPARAC | 5.5±0.8 | 4.5±0.8 | 3.0±0.6 | 3.0±0.4 | 2.0±0.4 | 2.0±0.4 | 1.5±0.3 | 1.0±0.3 | 1.0±0.3 | 0.0±0.2* | 0.0±0.2* |
| GCARP | 4.5±1.4 | 4.0±0.6 | 3.0±0.3 | 2.0±0.3 | 2.0±0.3 | 1.0±0.4 | 1.0±0.4 | 0.5±0.4 | 0.0±0.4* | 0.0±0.1* | 0.0±0.1* |
| GMELOX | 5±0.9 | 3.5±0.8 | 3.0±0.4 | 2.5±0.3 | 1.5±0.5 | 0.5±0.3 | 0.5±0.3 | 0.0±0.1* | 0.0±0.1* | 0.0±0.0* | 0.0±0.0* |