
Table 1
Ingredient and nutrient composition of the calves’ basal diet
| Ingredient | Value |
|---|---|
| Milk replacer | |
| Crude protein (%) | 20.0 |
| Crude oils and fats (%) | 8.0 |
| Ash (%) | 6.0 |
| Crude fibre (%) | 1.3 |
| Calcium (%) | 0.7 |
| Phosphorus (%) | 0.45 |
| Sodium (%) | 0.1 |
| Lysine (%) | 1.4 |
| Vitamin A (IU/kg) | 10,000 |
| Vitamin D3 (IU/kg) | 2,000 |
| Vitamin E (mg/kg) | 80 |
| Vitamin K3 (mg/kg) | 1.0 |
| Vitamin B1 (mg/kg) | 4.3 |
| Vitamin B2 (mg/kg) | 4.3 |
| Vitamin B6 (mg/kg) | 4.3 |
| Vitamin C (mg/kg) | 100 |
| Niacinamide (mg/kg) | 6.6 |
| Calcium D-pantothenate (mg/kg) | 8.6 |
| Folic acid (mg/kg) | 0.35 |
| Vitamin B12 (mg/kg) | 0.05 |
| Biotin (mg/kg) | 0.07 |
| Choline chloride (mg/kg) | 300 |
| Manganese (mg/kg) | 64 |
| Zinc (mg/kg) | 56 |
| Iron (mg/kg) | 80 |
| Copper (mg/kg) | 8 |
| Iodine (mg/kg) | 0.96 |
| Selenium (mg/kg) | 0.2 |
| Enterococcus faecium (cfu/kg) | 1.2 × 10⁹ |
| Mixed calf feed | |
| Crude protein (%) | 18.5 |
| Crude oils and fats (%) | 3.3 |
| Crude fibre max. (%) | 6.5 |
| Crude ash max. (%) | 9.0 |
| Phosphorus (%) | 0.8 |
| Calcium (%) | 1.3 |
| Sodium (%) | 0.23 |
| Magnesium (%) | 0.25 |
| Vitamin A (IU/kg) | 25,000 |
| Vitamin D3 (IU/kg) | 5,000 |
| Vitamin E (mg/kg) | 25.0 |
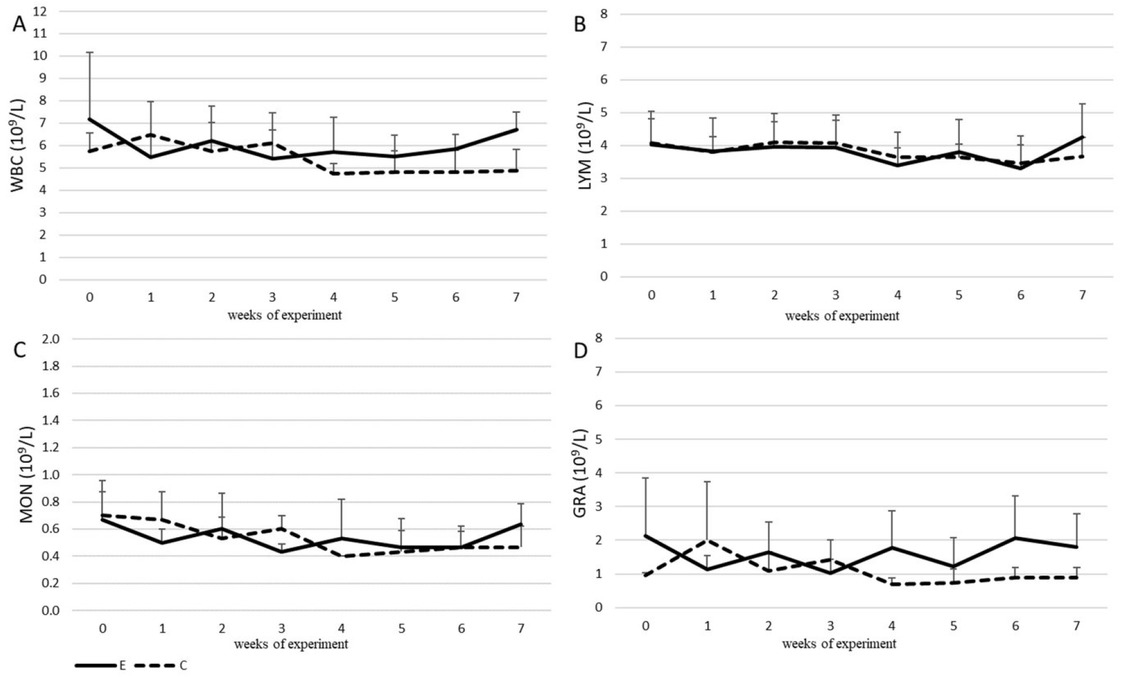
Fig. 1
Results of: 1A the total count of white blood cells (WBCs); and differentiated leukocyte counts as 1B lymphocytes (LYM); 1C monocytes (MON); and 1D granulocytes (GRA) in the peripheral blood of the examined calves. Data are presented as mean ± SD
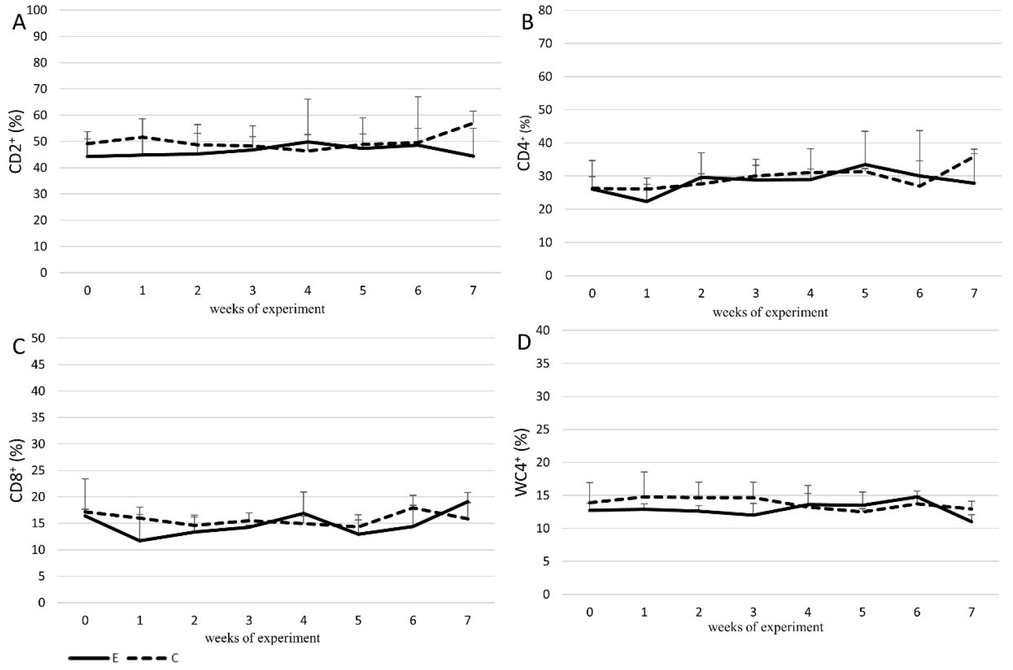
Fig. 2
Percentage of the lymphocyte subpopulations containing various surface antigens: 2A CD2+; 2B CD4+; 2C CD8+; and 2D WC4+ in the peripheral blood of the examined calves. Data are expressed as mean ± SD
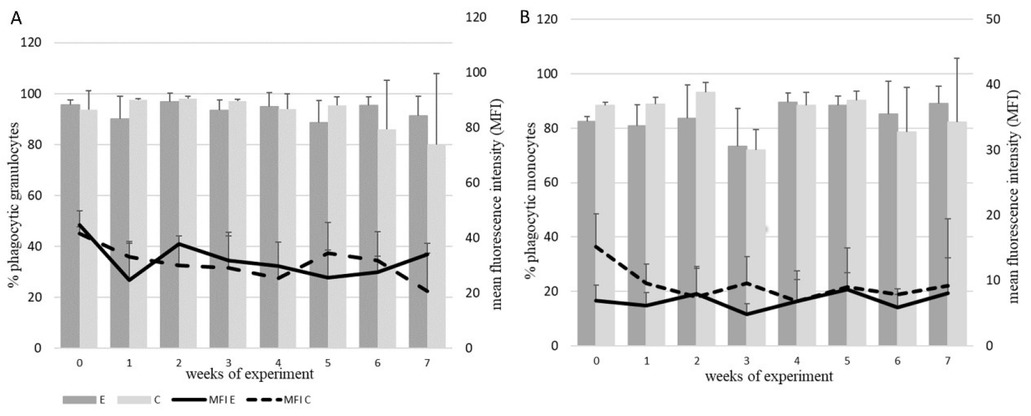
Fig. 3
Cytometric analysis of phagocytic activity of: A – granulocytes and B – monocytes in the peripheral blood of the E and C calves with values expressed as percentages of phagocytic cells, and with mean fluorescence intensity (MFI) expressed as the index of the phagocytosis intensity of the phagocytic cells. All data are expressed as mean ± SD
* – Statistically significant differences at P < 0.05 compared with the control
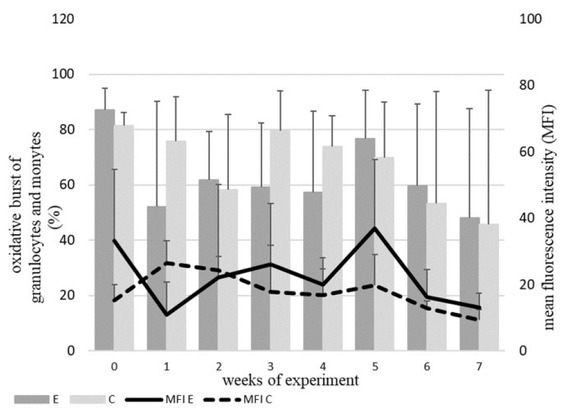
Fig. 4
Cytometric analysis of the oxidative burst activity of the granulocytes and monocytes in the peripheral blood of the calves from the E and C groups with values expressed as the percentage of cells that produce reactive oxidants and with the mean fluorescence intensity (MFI) expressed as the index of activity of cells with oxidative burst activity