
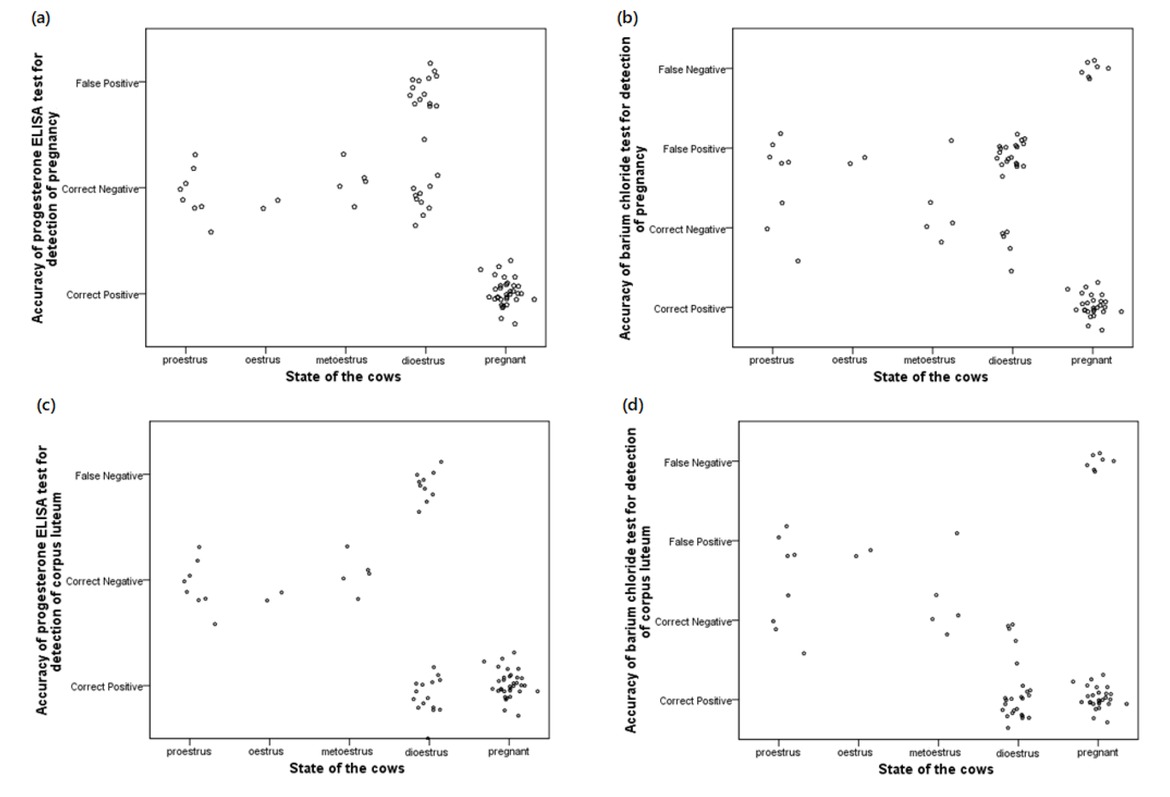
Fig. 1
Scatter plots showing result quality by phase in the oestrous cycle. Plots (a) and (b) show the accuracy of the progesterone ELISA and barium tests for pregnancy detection, while (c) and (d) show the accuracy of the tests for CL detection
Table 1
Correct positive, correct negative, false positive, and false-negative results by progesterone ELISA and barium chloride tests for detection of pregnancy and corpus luteum in cows
| Progesterone ELISA (number (%)) | Barium chloride test (number (%)) | Total | |||||||
|---|---|---|---|---|---|---|---|---|---|
| Correct positive | Correct negative | False- positive | False- negative | Correct positive | Correct negative | False- positive | False-negative | ||
| Pregnancy | 34 (45.9) | 25 (33.8) | 15 (20.3) | 0 | 27 (36.5) | 12 (16.2) | 28 (37.8) | 7 (9.5) | 74 (100.0) |
| CL | 49 (66.2) | 15 (20.3) | 0 | 10 (13.5) | 47 (63.5) | 13 (17.6) | 7 (9.5) | 7 (9.5) | 74 (100.0) |
Table 2
Values of sensitivity, specificity, positive predictive value (PPV), negative predictive value (NPV), and accuracy of progesterone ELISA-and barium chloride tests for detection of pregnancy and corpus luteum
| Method of detection | Sensitivity | Specificity | PPV | NPV | Accuracy | |
|---|---|---|---|---|---|---|
| Progesterone ELISA | Pregnancy | 100.0 | 62.5 | 69.4 | 100.0 | 79.7 |
| CL | 83.0 | 100.0 | 100.0 | 60.0 | 86.4 | |
| Barium chloride test | Pregnancy | 79.4 | 30.0 | 49.0 | 63.0 | 52.7 |
| CL | 87.0 | 65.0 | 87.0 | 65.0 | 81.0 |