
Table 1
The average number of cells from the erythroblastic cell line in relation to 1,000 of all porcine bone marrow cells (mean ± SD) on day 0
| Parameter | Control | LD | HD |
|---|---|---|---|
| PROERBL | 20.6 ± 2.72 | 20.2 ± 2.24 | 21 ± 1.6 |
| BASO ERBL | 25.8 ± 3.76 | 27.2 ± 2.56 | 24.6 ± 3.68 |
| POLY ERBL | 75.8 ± 13.76 | 69.2 ± 9.84 | 78.4 ± 9.52 |
| ORTHO ERBL | 202 ± 15.6 | 196.2 ± 9.36 | 201.2 ± 7.36 |
| TOTAL NORMO | 324.2 ± 29.84 | 312.8 ± 15.76 | 325.2 ± 16.96 |
| PROMEGALOBL | 0 | 0 | 0 |
| BASO MEGALO | 0 | 0 | 0 |
| POLY MEGALO | 0 | 0 | 0 |
| TOTAL MEGALO | 0 | 0 | 0 |
| NORMO/MEGAL | 0 | 0 | 0 |
| PARA ERB | 0.6 ± 0.72 | 0 | 0 |
| TOTAL ERBL | 324.8 ± 29.76 | 312.8 ± 15.76 | 325.2 ± 16.96 |
[i] PROERBL – proerythroblast; BASO ERBL – basophilic erythroblast; POLY ERBL – polychromatic erythroblast; ORTO ERBL – orthochromatic erythroblast; TOTAL NORMO – total number of normocytes; PROMEGALOBL – promegaloblast; BASO MEGALO – basophilic megaloblasts; POLY MEGALO – polychromatic megaloblast; TOTAL MEGALO – total number of megaloblasts; NORMO/MEGALO – normoblasts/megaloblasts; PARA ERB – paraerythroblast; TOTAL ERBL – total number of cells from erythroblastic cell line
Table 2
The average number of cells from the erythroblastic cell line in relation to 1,000 of all porcine bone marrow cells (mean ± SD) on day 28
| Parameter | Control | LD | HD |
|---|---|---|---|
| PROERBL | 21.2b ± 1.84 | 18.6c ± 2.48 | 26ac ± 6.4 |
| BASO ERBL | 24.4a ± 2.27 | 18.8ac ± 3.76 | 25.8c ± 3.84 |
| POLY ERBL | 70.2ab ± 6.2 | 60.6ac ± 15.12 | 56.6bc ± 7.92 |
| ORTO ERBL | 190ab ± 11.2 | 165ac ± 7.2 | 91.2bc ± 10.96 |
| TOTAL NORMO | 305.8ab ± 14.96 | 263ac ± 14 | 201.8bc ± 11.84 |
| PROMEGALOBL | 0 | 0 | 0 |
| BASO MEGALO | 0 | 0 | 0 |
| POLY MEGALO | 0 | 0 | 0 |
| TOTAL MEGALO | 0 | 0 | 0 |
| NORMO/MEGALO | 0 | 0 | 0 |
| PARA ERBL | 0 | 0 | 0 |
| TOTAL ERBL | 305.8ab ± 14.96 | 263ac ± 14 | 201.8bc ± 11.84 |
[i] Statistically significant differences (P < 0.05) are marked by a – difference between the control and LD groups; b – difference between control and HD groups; c – difference between LD and HD groups. Abbreviations as in Table 1
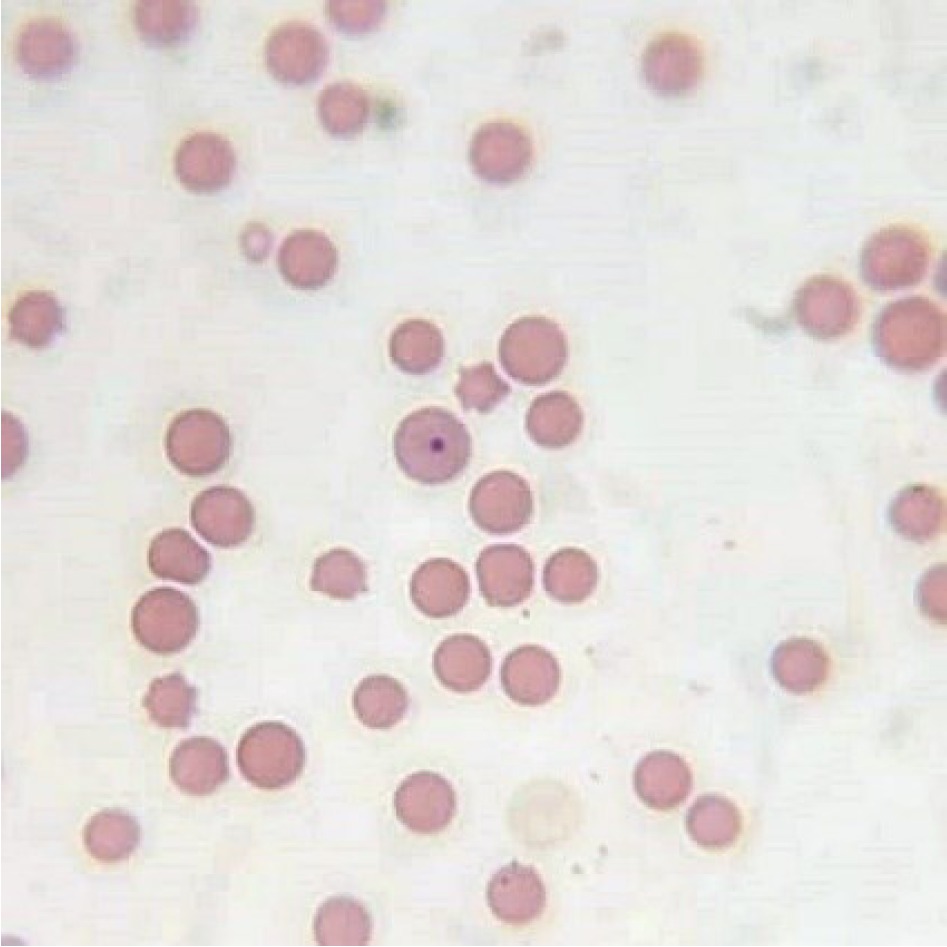
Fig. 1
Representative cytological image of a bone marrow smear stained with the May–Grünwald–Giemsa method showing a Howell– Jolly body in erythrocyte in the HD group on day 28; 1,000×
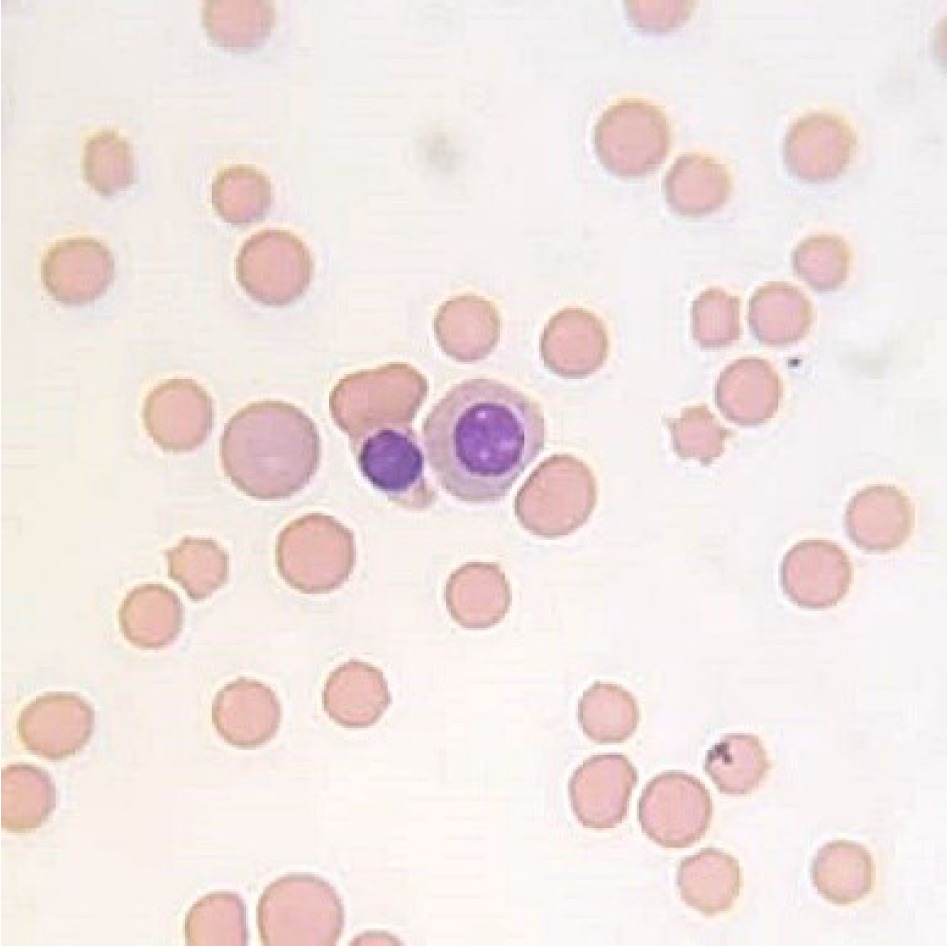
Fig. 2
Representative cytological image of a bone marrow smear stained with the May–Grünwald–Giemsa method showing basophilic and normochromatic erythroblasts in the control group on day 0; 1,000×
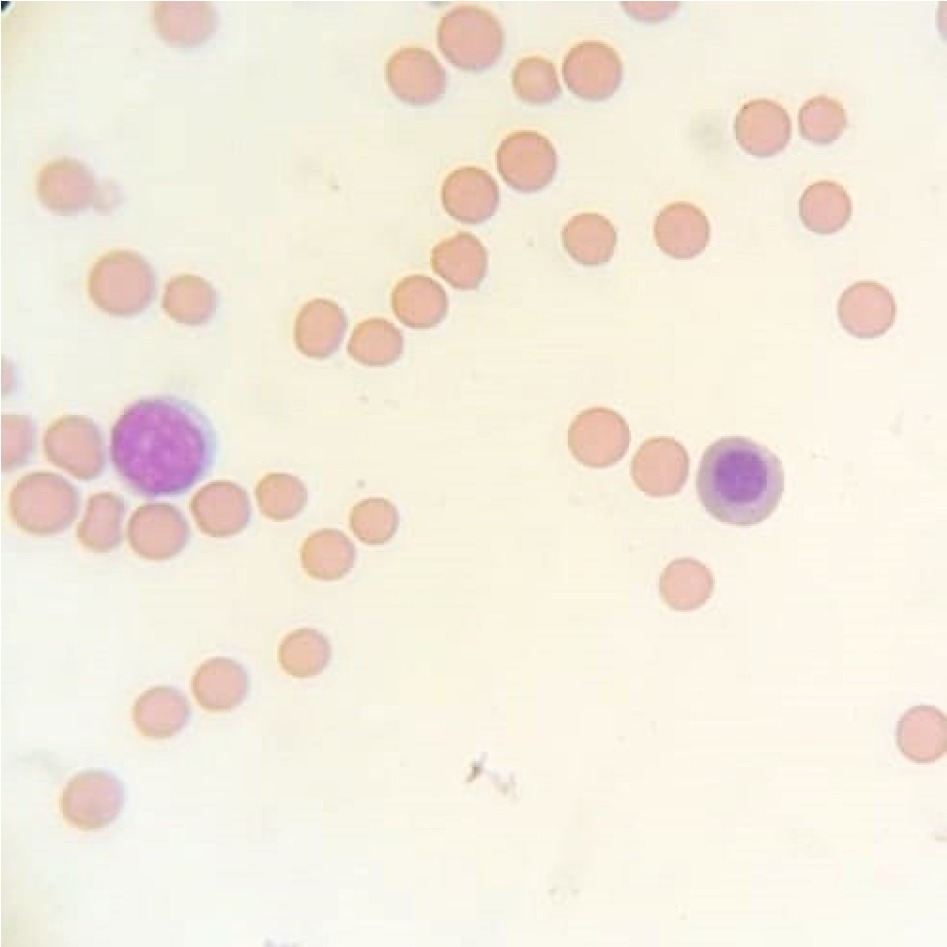
Fig. 3
Representative cytological image of a bone marrow smear stained with the May–Grünwald–Giemsa method showing basophilic erythroblasts in the LD group on day 28; 1,000×
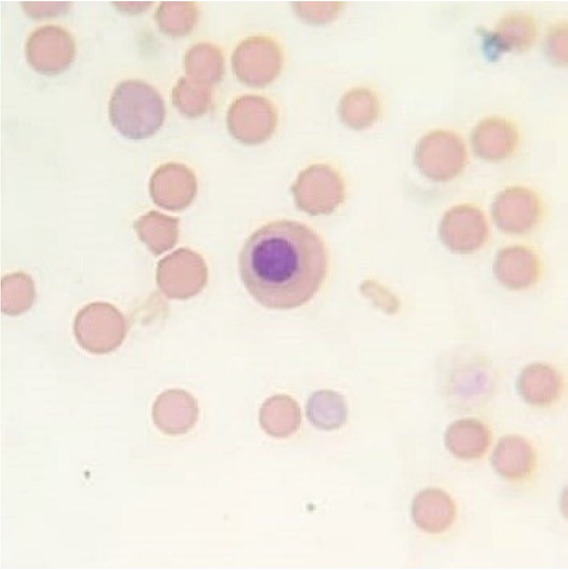
Fig. 4
Representative cytological image of a bone marrow smear stained with the May–Grünwald–Giemsa method showing polychromatic erythroblasts in the LD group on day 28; 1,000×
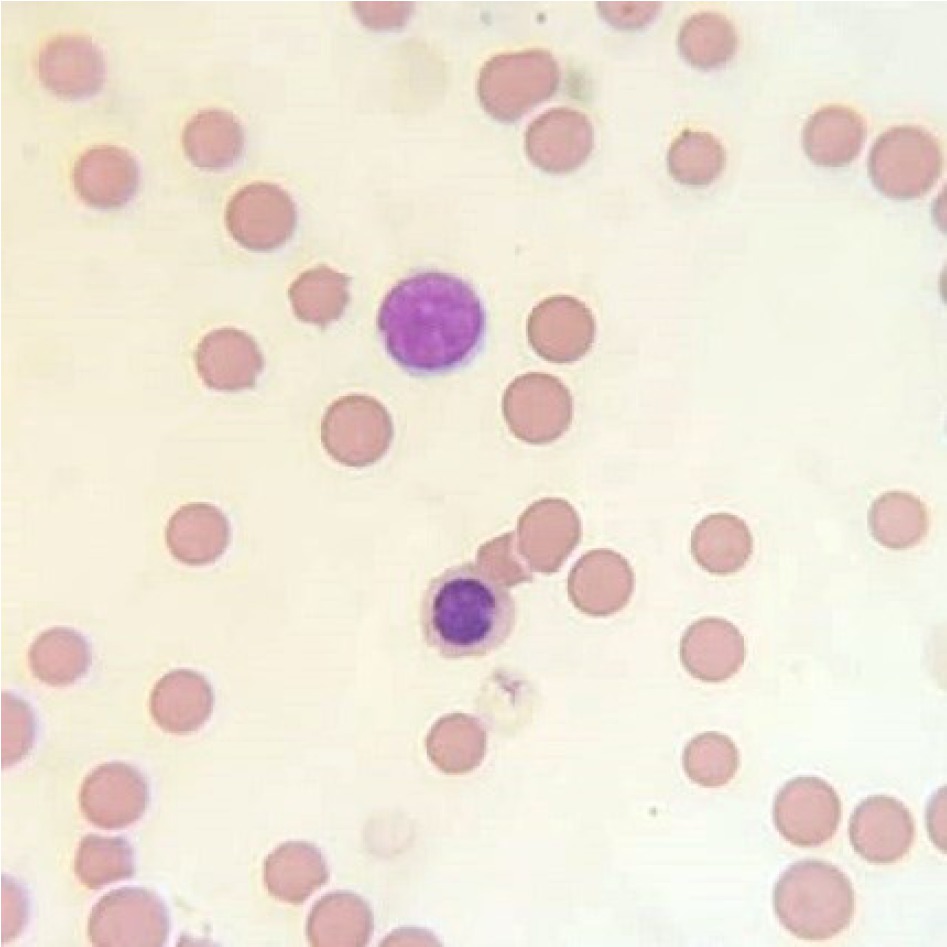
Fig. 5
Representative cytological image of a bone marrow smear stained with the May–Grünwald–Giemsa method showing polychromatic erythroblasts in the HD group on day 28; 1,000×
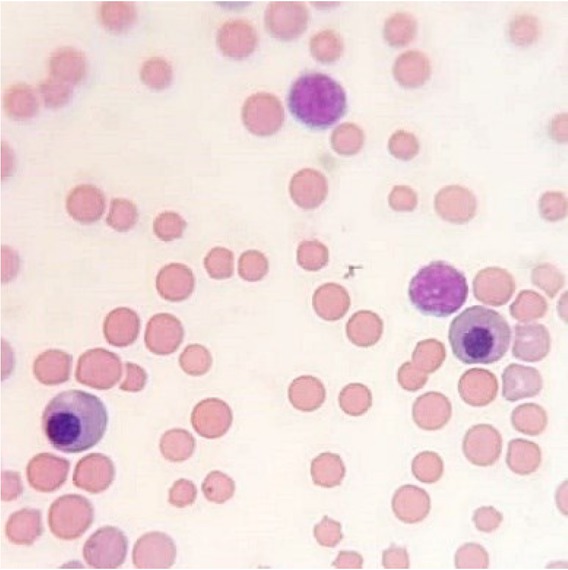
Fig. 6
Representative cytological image of a bone marrow smear stained with the May–Grünwald–Giemsa method showing basophilic erythroblasts in the HD group on day 28; 1,000×