
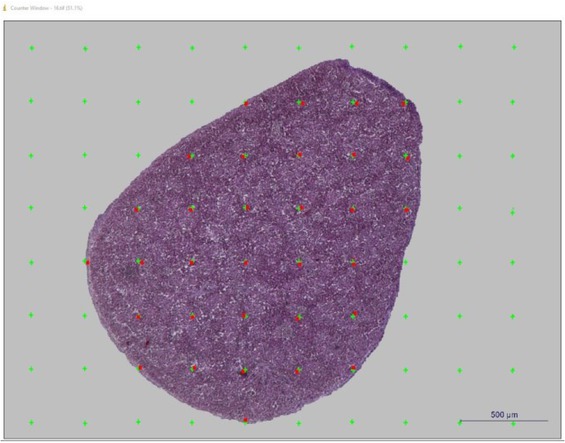
Fig. 1
Application of point counting grid on histological sections of the spleen
Table 1
Measurement data of structures in the spleen and bursa of Fabricius according to days of incubation (mean ± SE)
| Day of incubation | Group | Spleen weight (g) | Spleen capsule thickness (μm) | Spleen volume (mL) | CE | FAE thickness (μm) | IFE thickness (μm) |
|---|---|---|---|---|---|---|---|
| 10th | C | 0.001 ± 0.0 | 2.030 ± 0.112b | 0.452 ± 0.042 | 0.044 | 15.540 ± 1.233b | 17.642 ± 1.106b |
| SY200 | 0.001 ± 0.0 | 1.694 ± 0.195b | 0.480 ± 0.033 | 0.042 | 11.092 ± 1.161a | 14.945 ± 0.424ab | |
| SY1,000 | 0.002 ± 0.0 | 0.850 ± 0.317a | 0.451 ± 0.027 | 0.047 | 10.565 ± 0.366a | 13.882 ± 1.075a | |
| SY2,000 | 0.002 ± 0.0 | 0.834 ± 0.285a | 0.485 ± 0.028 | 0.046 | 9.962 ± 1.120a | 13.862 ± 0.878a | |
| 13th | C | 0.050 ± 0.004b | 11.051 ± 1.897 | 2.538 ± 0.305 | 0.046 | 16.178 ± 2.113b | 20.750 ± 1.492b |
| SY200 | 0.005 ± 0.001a | 10.399 ± 1.070 | 1.784 ± 0.147 | 0.044 | 14.178 ± 1.662ab | 16.882 ± 2.436ab | |
| SY1,000 | 0.006 ± 0.001a | 9.232 ± 0.884 | 2.386 ± 0.172 | 0.041 | 11.142 ± 1.281a | 15.392 ± 1.162a | |
| SY2,000 | 0.005 ± 0.001a | 7.587 ± 0.639 | 2.172 ± 0.218 | 0.042 | 10.631 ± 0.414a | 14.355 ± 1.099a | |
| 16th | C | 0.115 ± 0.011b | 16.412 ± 1.154 | 4.280 ± 0.392 | 0.029 | 16.166 ± 0.777b | 17.043 ± 1.187b |
| SY200 | 0.011 ± 0.001a | 15.892 ± 1.759 | 4.952 ± 0.589 | 0.045 | 14.525 ± 0.997ab | 14.135 ± 1.305ab | |
| SY1,000 | 0.009 ± 0.002a | 15.339 ± 1.247 | 4.536 ± 0.578 | 0.028 | 12.015 ± 0.879a | 13.562 ± 0.613ab | |
| SY2,000 | 0.013 ± 0.001a | 12.424 ± 0.822 | 4.473 ± 0.682 | 0.031 | 11.508 ± 0.408a | 12.525 ± 0.841a | |
| 21st | C | 0.089 ± 0.012b | 20.418 ± 1.413b | 6.832 ± 0.491b | 0.019 | 21.025 ± 2.488b | 22.492 ± 2.609b |
| SY200 | 0.007 ± 0.001a | 16.386 ± 1.028ab | 6.001 ± 0.378ab | 0.021 | 14.983 ± 2.056ab | 19.708 ± 0.857ab | |
| SY1,000 | 0.009 ± 0.002a | 14.804 ± 0.807a | 4.576 ± 0.426a | 0.031 | 14.798 ± 1.640a | 19.002 ± 1.641ab | |
| SY2,000 | 0.009 ± 0.001a | 14.168 ± 1.367a | 4.676 ± 0.143a | 0.024 | 12.920 ± 0.836a | 12.572 ± 1.197a | |
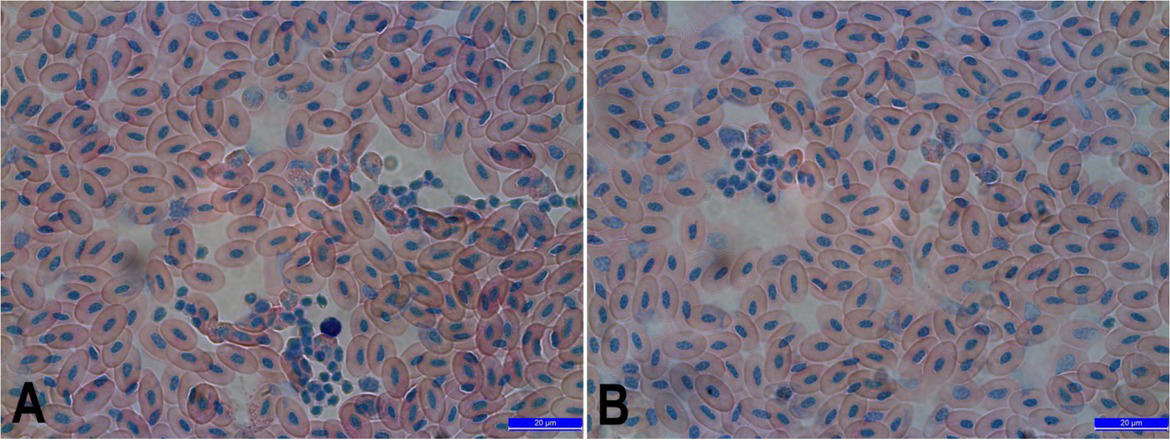
Fig. 2
Light microscopic images of peripheral blood smears on the 21st day of incubation. Eosinophils, heterophils, and lymphocytes were seen in the peripheral blood smear from chick embryos treated with SY2,000 (A) and SY1,000 (B)
Table 2
The proportions of peripheral blood leukocyte for the sampled days of incubation (%) ±SE
| Day incubation of | Group | Heterophil | Eosinophil | Lymphocyte | Monocyte | Basophil |
|---|---|---|---|---|---|---|
| 13th | C | + | + | +++ | - | - |
| SY200 | + | + | +++ | - | - | |
| SY1,000 | ++ | ++ | +++ | - | - | |
| SY2,000 | ++ | ++ | +++ | - | - | |
| 16th | C | +++ | + | ++ | - | - |
| SY200 | +++ | + | ++ | - | - | |
| SY1,000 | + | +++ | ++ | - | - | |
| SY2,000 | + | +++ | ++ | - | - | |
| 21st | C | 58.83 ± 2.68b | 1.67 ± 0.21a | 37.83 ± 2.74b | 1.00 ± 0.26b | 0.50 ± 0.22 |
| SY200 | 54.00 ± 3.22b | 17.67 ± 1.28b | 26.50 ± 2.72b | 0.67 ± 0.33ab | 1.66 ± 0.33 | |
| SY1,000 | 24.00 ± 1.61a | 43.00 ± 3.62c | 30.50 ± 2.06b | 0.20 ± 0.21a | 0.83 ± 0.40 | |
| SY2,000 | 27.17 ± 4.30a | 47.33 ± 4.89c | 24.50 ± 5.23a | 0.17 ± 0.16a | 0.83 ± 0.40 | |
b Values within a column with no common superscripts are significantly (P < 0.05) different. + a few; ++ moderate; +++ mostly; ̶ not seen
a Values within a column with no common superscripts are significantly (P < 0.05) different. + a few; ++ moderate; +++ mostly; ̶ not seen
b Values within a column with no common superscripts are significantly (P < 0.05) different. + a few; ++ moderate; +++ mostly; ̶ not seen
b Values within a column with no common superscripts are significantly (P < 0.05) different. + a few; ++ moderate; +++ mostly; ̶ not seen
b Values within a column with no common superscripts are significantly (P < 0.05) different. + a few; ++ moderate; +++ mostly; ̶ not seen
b Values within a column with no common superscripts are significantly (P < 0.05) different. + a few; ++ moderate; +++ mostly; ̶ not seen
b Values within a column with no common superscripts are significantly (P < 0.05) different. + a few; ++ moderate; +++ mostly; ̶ not seen
ab Values within a column with no common superscripts are significantly (P < 0.05) different. + a few; ++ moderate; +++ mostly; ̶ not seen
a Values within a column with no common superscripts are significantly (P < 0.05) different. + a few; ++ moderate; +++ mostly; ̶ not seen
c Values within a column with no common superscripts are significantly (P < 0.05) different. + a few; ++ moderate; +++ mostly; ̶ not seen
b Values within a column with no common superscripts are significantly (P < 0.05) different. + a few; ++ moderate; +++ mostly; ̶ not seen
a Values within a column with no common superscripts are significantly (P < 0.05) different. + a few; ++ moderate; +++ mostly; ̶ not seen
a Values within a column with no common superscripts are significantly (P < 0.05) different. + a few; ++ moderate; +++ mostly; ̶ not seen
c Values within a column with no common superscripts are significantly (P < 0.05) different. + a few; ++ moderate; +++ mostly; ̶ not seen
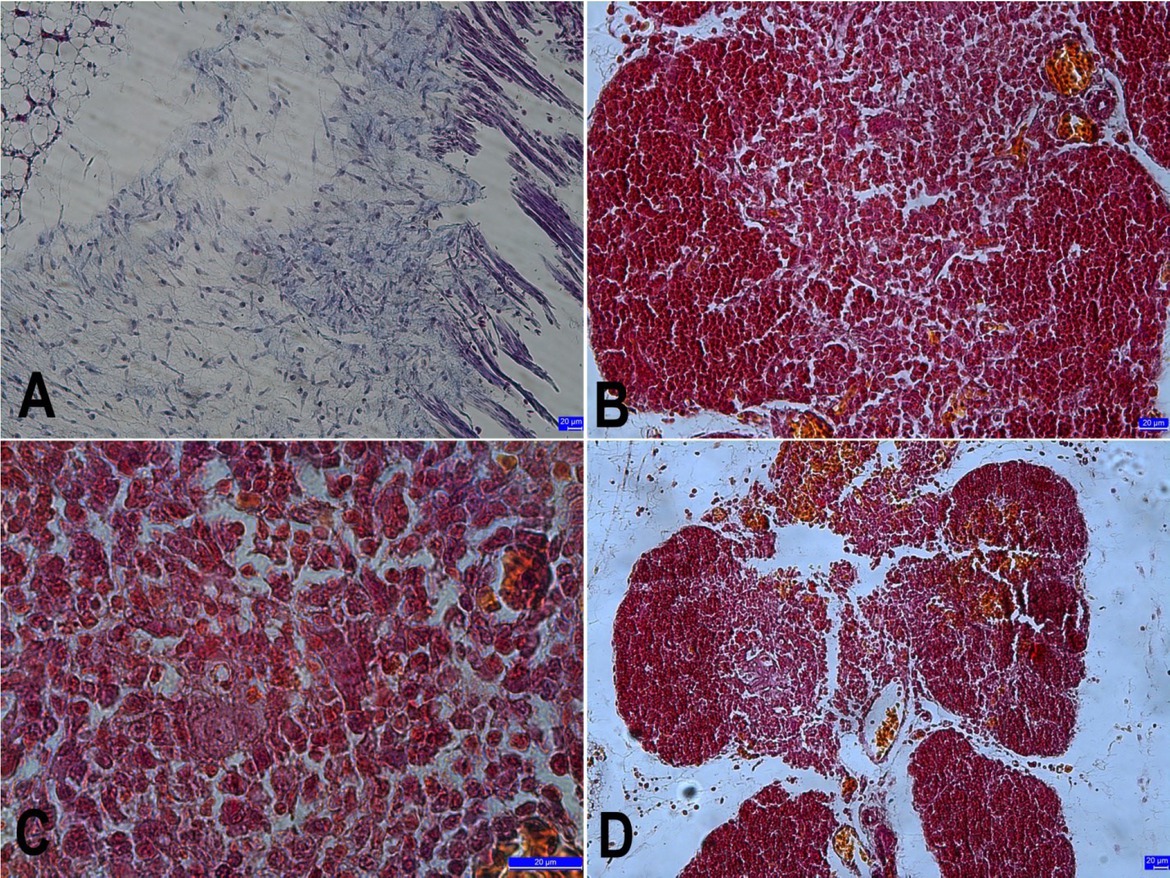
Fig. 3
Light microscopic images of the thymus sections in different embryonic periods. A – the thymus section from a day 10 chick embryo in the control group; B – the thymus section from a day 21 chick embryo treated with SY200; C– the thymus section from a day 21 chick embryo treated with SY1,000 showing Hassall’s corpuscles; D – the thymus section from a day 21 chick embryo treated with SY2,000
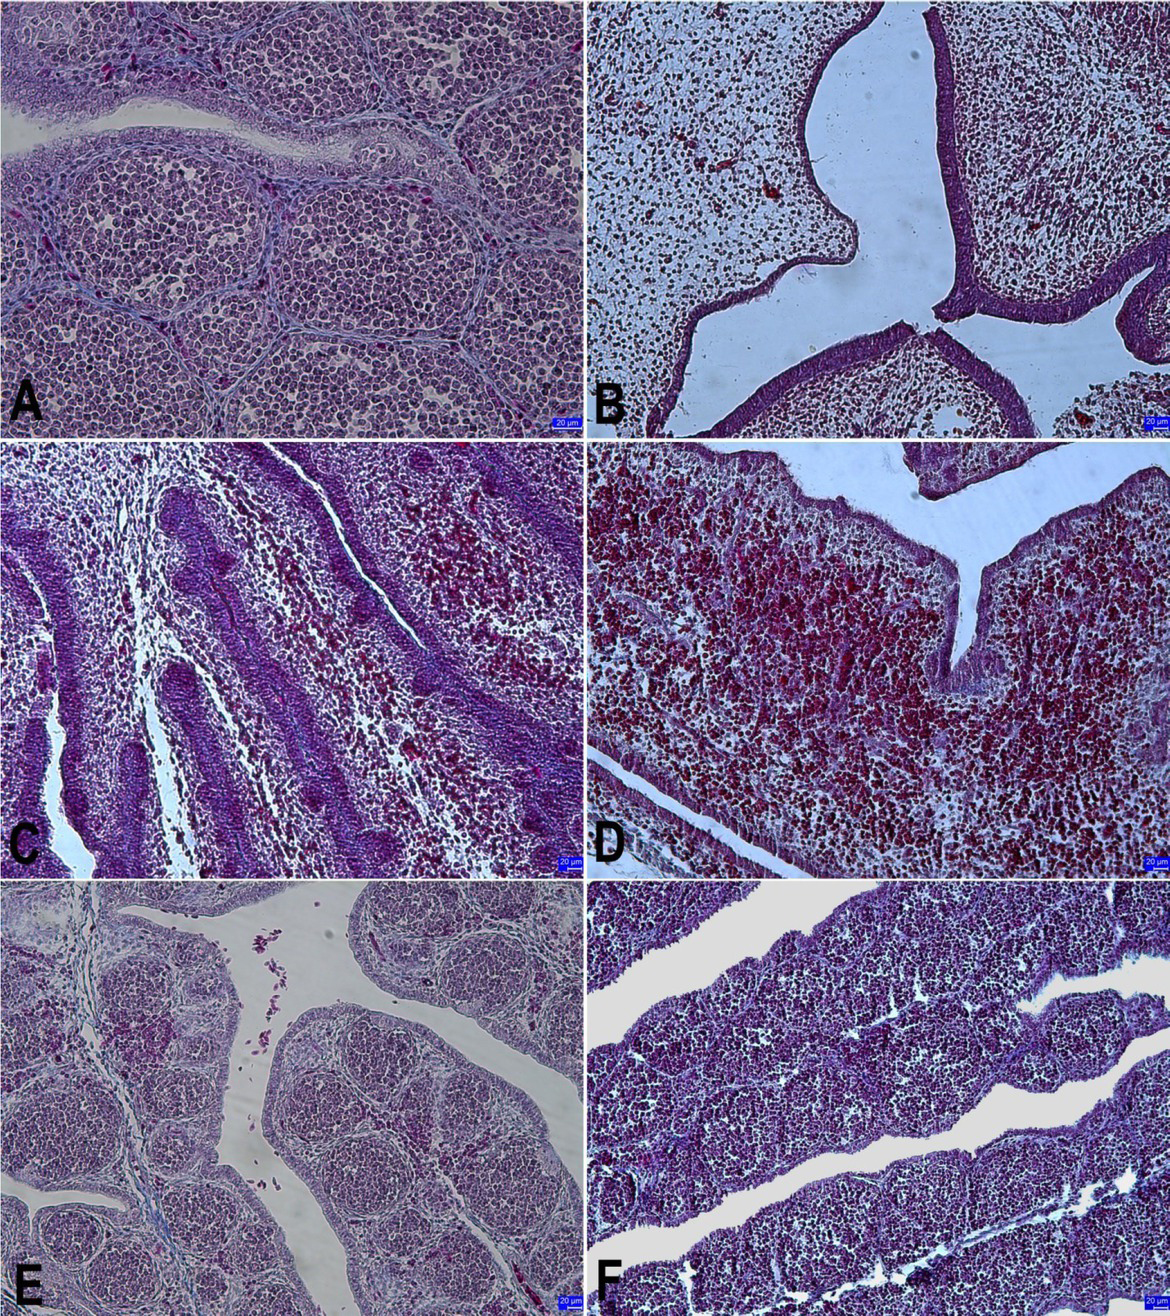
Fig. 4
The bursa of Fabricius sections in different embryonic periods. A – the bursa of Fabricius section from a day 21 chick embryo in the control group showing FAE and IFE; B – the bursa of Fabricius section from a day 10 chick embryo treated with SY200; C – the bursa of Fabricius section from a day 13 chick embryo treated with SY1,000 showing epithelial buddings; D – the bursa of Fabricius section from a day 13 chick embryo treated with SY2,000; E – normal histological image of bursa of Fabricius section from a day 16 chick embryo in the control group; F – the bursa of Fabricius section from a day 21 chick embryo treated with SY2,000
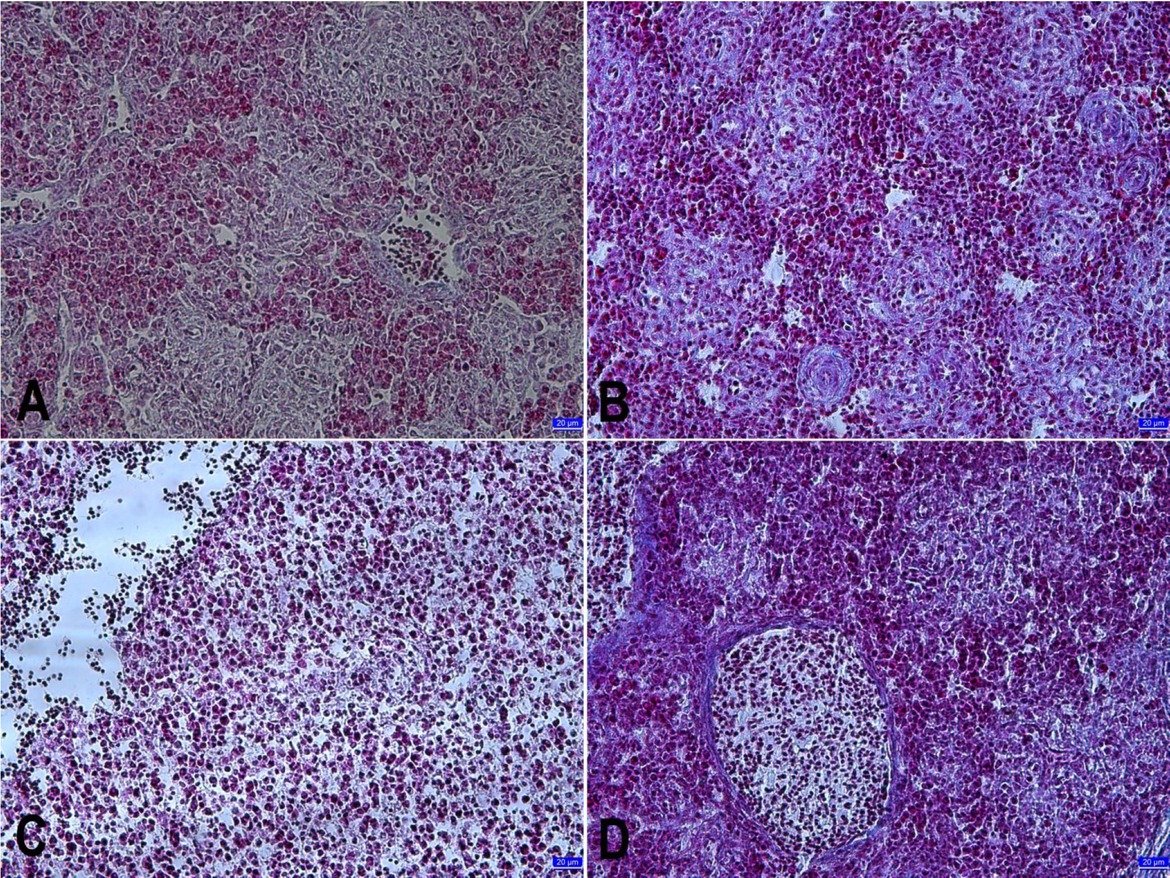
Fig. 5
The spleen sections in different embryonic periods. A – normal histological image of a spleen section from a day 16 chick embryo in the control group; B – the spleen section from a day 21 chick embryo treated with SY200; C – the spleen section from a day 16 chick embryo treated with SY1,000 showing mononuclear cell infiltration; D – the spleen section from a day 21 chick embryo treated with SY2,000