
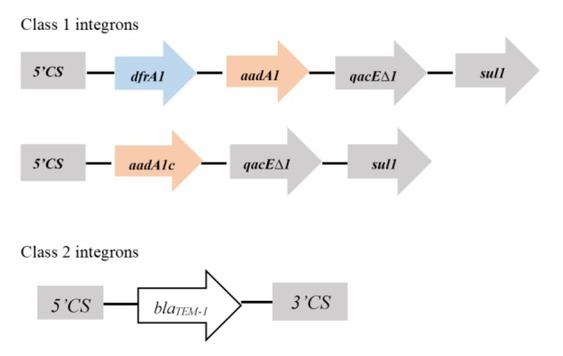
Fig. 1
Primers used in this study
| Primer | Target gene | Sequence (5′–3′) | Product size (bp) |
|---|---|---|---|
| intl1-F | intI-1 | CCTCCCGCACGATGATC | 280 |
| intl1-R | TCCACGCATCGTCAGGC | ||
| intI2-F | TTATTGCTGGGATTAGGC | ||
| intI2-R | intI-2 | ACGGCTACCCTCTGTTATC | 233 |
| intI3-F | intI-3 | AGTGGGTGGCGAATGAGTG | 600 |
| intI3-R | TGTTCTTGTATCGGCAGGTG | ||
| intl1-k | variable region 1 | ACCGAAACCTTGCGCTCGT | Variable |
| lnB | AAGCAGACTTGACCTGAT | ||
| hep74 | CGGGATCCCGGACGGCATGCAC | ||
| variable region 2 | GATTTGTA | Variable | |
| hep51 | GATGCCATCGCAAGTACGAG | ||
Different types of gene cassette amplicons among the integron-bearing S_ aureus
| Types of integrons | Number of isolates carrying different cassettes (%) | Approximate sizes of amplicon (bp) | Inserted cassette(s) |
|---|---|---|---|
| 25 (41.7%) | 1,200 | aadA1c | |
| Integron 1 | 1 (1.7%) | 2,000 | dfrA1 + aadA1 |
| 14 (23.3%) | 1,200, 2,000 | aadA1c, dfrA1 + aadA1 | |
| Integron 2 | 58 (85.3%) | 700 | blaTEM-1 |
Comparison of detection rates of class 1 and 2 integrons in plasmid and genomic DNA in pig farm-derived S_ aureus
| Types of DNA | Class 1 integrons | Class 2 integrons | ||
|---|---|---|---|---|
| Number of positive (negative) strains | Positive rate (%) | Number of positive (negative) strains | Positive rate (%) | |
| Genomic DNA | 25 (43) | 36.8 | 31 (37) | 45.6 |
| Plasmid DNA | 60 (8) | 88.2 | 68 (0) | 100 |
| χ2 | 38.43 | 50.83 | ||
| P-value | <0.001 | <0.001 | ||
The prevalence of pig farm-derived S_ aureus
| Sample sources | Number of samples from each source | Number of positive isolates (%) | Number of MRSA strains among the positive isolates (%) |
|---|---|---|---|
| Faeces | 426 | 43 (10.1%) | 35 (81.4%) |
| Floor | 215 | 11 (5.1%) | 9 (81.8%) |
| Water | 22 | 3 (13.6%) | 2 (66.7%) |
| Feed | 20 | 6 (30.0%) | 6 (100%) |
| Air | 41 | 5 (12.2%) | 5 (100%) |
| Total | 724 | 68 (9.4%) | 57 (83.8%) |
Antibiotic-resistant phenotypes and genotypes of S_ aureus in this study
| Antimicrobial subclass | Antimicrobial agent | Phenotypes (n = 68) | Genotypes (number of isolates containing different resistance gene cassettes) | |||
|---|---|---|---|---|---|---|
| Number of resistant isolates (%) | Number of sensitive isolates | Class 1 integron (n = 60) | Class 2 integron (n = 68) | |||
| aadA1c or aadA1 | dfrA1 | blaTEM-1 | ||||
| Penicillin | 68 (100) | - | - | - | 58 | |
| β-lactams | Oxacillin | 60 (88.2) | - | - | - | 50 |
| - | 8 | - | - | 8 | ||
| Tetracyclines | Tetracycline | 68 (100) | - | - | - | - |
| Macrolides | Erythromycin | 68 (100) | - | - | - | - |
| 46 (67.6) | - | - | - | - | ||
| Phenicols | Chloramphenicol | - | 22 | - | - | - |
| Folate pathway | 15 (22.1) | - | - | 2 | - | |
| inhibitors | Trimethoprim-sulfamethoxazole | - | 53 | - | 12 | - |
| 7 (10.3) | - | - | - | - | ||
| Lincosamides | Clindamycin | - | 61 | - | - | - |
| Rifamycins | Rifamycin | 2 (2.9) | - | - | - | - |
| - | 66 | - | - | - | ||
| Aminoglycosides | Gentamicin | 1 (1.5) | - | 1 | - | - |
| - | 67 | 39 | - | - | ||
| Ciprofloxacin | 1 (1.5) | - | - | - | - | |
| Quinolones | - | 67 | - | - | - | |
| Levofloxacin | 1 (1.5) | - | - | - | - | |
| - | 67 | - | - | - | ||
| Nitrofurans | Nitrofurantoin | - | 68 | - | - | - |
| Glycopeptides | Teicoplanin | - | 68 | - | - | - |