
Fig. 1
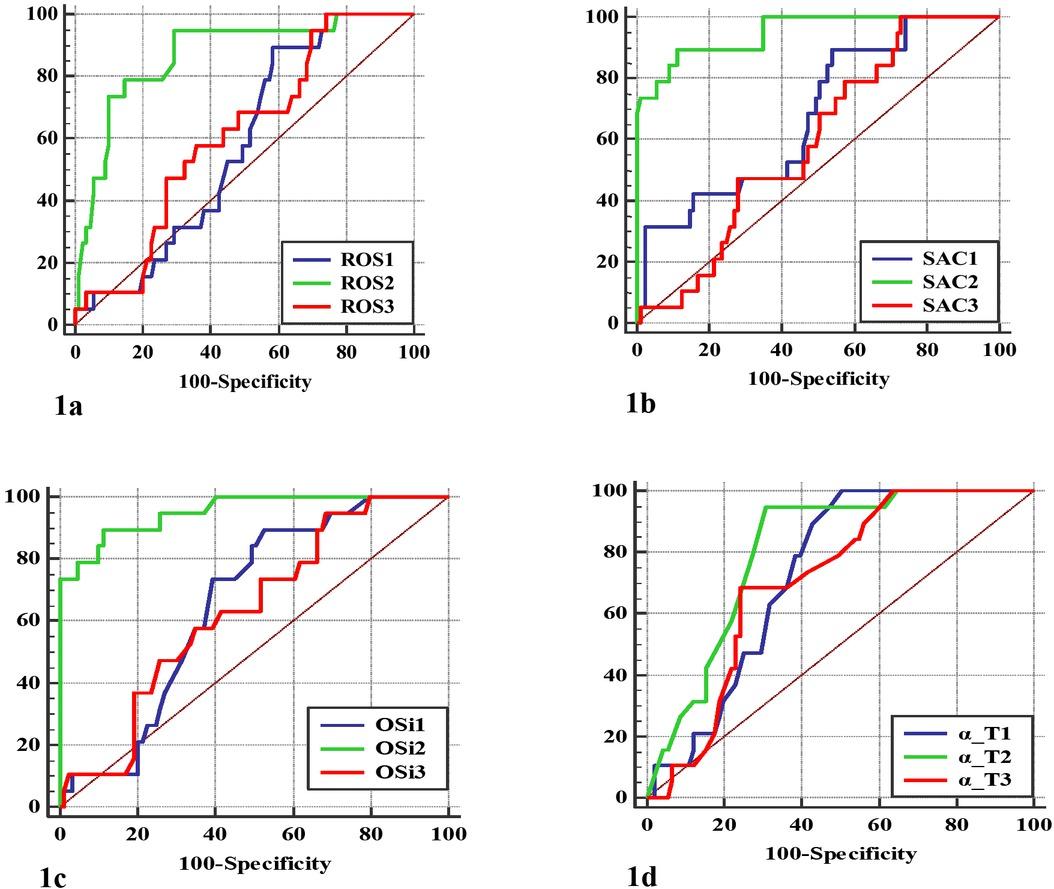
Diagnostic performance (receiver operating characteristic curve coordinates) of ROS, SAC, OSi and α-T as predictors of mastitis incidence at dry-off, calving and 30 d post-partum
| Biomarker /Sampling point | Area (AUC) Under Curve | Cut-off (Threshold) | Sensitivity | Specificity | P-value |
|---|---|---|---|---|---|
| Dry-off | |||||
| ROS | 0.586a ± 0.060 | >50.0 | 89.5 | 42.9 | ns (0.16) |
| SAC | 0.674ab ± 0.067 | ≤450.4 | 89.5 | 45.1 | ** |
| OSi | 0.663b ± 0.057 | >0.113 | 89.5 | 48.4 | ** |
| α-T | 0.730b ± 0.048 | ≤ 5.2 | 100 | 49.5 | *** |
| Calving | |||||
| ROS | 0.869a ± 0.046 | >70.2 | 94.7 | 71.1 | *** |
| SAC | 0.949b ± 0.027 | ≤320.4 | 89.5 | 88.9 | *** |
| OSi | 0.952b ± 0.026 | >0.224 | 89.5 | 88.9 | *** |
| α -T | 0.805a ± 0.045 | ≤1.9 | 94.7 | 69.2 | *** |
| 30 d post-partum | |||||
| ROS | 0.614ab ± 0.064 | >46.7 | 100 | 26.7 | ns (0.075) |
| SAC | 0.592a ± 0.063 | ≤467.3 | 100 | 26.7 | ns (0.14) |
| OSi | 0.636ab ± 0.064 | >0.106 | 94.7 | 32.2 | * |
| α -T | 0.710b ± 0.053 | ≤4.5 | 68.4 | 75.8 | *** |
Effect of the health of the udder (healthy or mastitic) on ROS (CarrU), SAC (μmol HClO/ml) and OSi (ROS/SAC) in the blood of dairy cows at dry-off, calving and 30d post-partum_ Group A – healthy animals; Group B – mastitic animals_ Values are presented as LSM ± SEM
| Parameter | Group A | Group B |
|---|---|---|
| Dry-off | ||
| ROS | 51.87a, 1 ± 0.85 | 54.85a, 1 ± 1.87 |
| SAC | 447.31a, 1 ± 2.52 | 431.64a, 1 ± 5.52 |
| OSi | 0.117a, 1 ± 0.002 | 0.127a, 1 ± 0.005 |
| Calving | ||
| ROS | 65.89a, 2 ± 0.86 | 75.04b, 2 ± 1.87 |
| SAC | 347.38a, 2 ± 2.54 | 312.38b, 2 ± 5.52 |
| OSi | 0.191a, 2 ± 0.002 | 0.240b, 2 ± 0.005 |
| 30 d post-partum | ||
| ROS | 53.46a, 1 ± 0.86 | 57.07a, 1 ± 1.87 |
| SAC | 451.42a, 1 ± 2.54 | 440.36a, 1 ± 5.52 |
| OSi | 0.118a, 1 ± 0.002 | 0.130a, 1 ± 0.005 |