
Table 1
Results of semi-quantitative erythrocyte morphological analysis based on the number of abnormal cells in a single cell layer at 1,000 × magnification. Adapted from (24)
| 1+ | 2+ | 3+ | 4+ | |
| Anisocytosic cells | ||||
| Dog | 7–15 | 16–20 | 21–29 | > 30 |
| Polychromatic cells | ||||
| Dog | 2–7 | 8–14 | 15–29 | > 30 |
| Hypochromic cells | 1–10 | 11–50 | 51–200 | > 200 |
| Poikilocytosic cells | 3–10 | 11–50 | 51–200 | > 200 |
| Codocytes | 3–5 | 6–15 | 16–30 | > 30 |
| Spherocytes | 5–10 | 11–50 | 51–150 | > 150 |
| Echinocytes | 5–10 | 11–100 | 101–250 | > 250 |
| Other shapes* | 1–2 | 3–8 | 9–20 | > 20 |
Table 2
Comparison of chosen haematological parameter results obtained using two different analysers Group
| Group | ||||||
|---|---|---|---|---|---|---|
| Analyser | ||||||
| A | B1 | B2 | Cc | Dc | ||
| WBC (K/μL) | Laser Cyte | 7.40 ± 2.61 | 7.31 ± 2.63 | 8.94 ± 2.59 | 8.62 ± 2.74 | 10.22 ± 2.58 |
| Vet ABC | 7.68 ± 2.41 | 7.39 ± 2.23 | 8.76 ± 2.84 | 9.12 ± 2.90 | 10.32 ± 2.87 | |
| RBC (M/μL) | Laser Cyte | 6.86 ± 0.63 | 7.30 ± 0.89 | 7.10 ± 0.90 | 6.99 ± 0.69 | 6.95 ± 1.23 |
| Vet ABC | 6.98 ± 0.59 | 7.51 ± 0.91 | 7.05 ± 0.55 | 7.14 ± 0.68 | 7.14 ± 1.27 | |
| HCT (%) | Laser Cyte | 49.04 ± 5.65 | 51.33 ± 5.11 | 50.19 ± 0.10 | 48.56 ± 4.29 | 47.9 ± 7.42 |
| Vet ABC | 49.75 ± 4.59 | 52.5 ± 623 | 48.9 ± 4.00 | 49.1 ± 4.66 | 48.6 ± 7.76 | |
| HGB (mmol/L) | Laser Cyte | 10.13 ± 0.87 | 10.77 ± 1.08 | 10.34 ± 0.72 | 10.21 ± 0.92 | 10.05 ± 1.30 |
| VetABC | 10.01 ± 1.07 | 11.39 ± 2.58 | 9.94 ± 0.77 | 10.09 ± 1.31 | 11.35 ± 3.66 | |
| MCH (fmol) | Laser Cyte | 1.47 ± 0.08 | 1.47 ± 0.11 | 1.46 ± 0.12 | 1.46 ± 0.10 | 1.46 ± 0.11 |
| Vet ABC | 1.43 ± 0.07 | 1.41 ± 0.06 | 1.41 ± 0.06 | 1.38 ± 0.06 | 1.38 ± 0.05 | |
| MCHC (mmol/L) | Laser Cyte | 20.73 ± 1.21 | 20.99 ± 1.48 | 20.71 ± 1.39 | 20.94 ± 1.20 | 21.23 ± 1.32 |
| Vet ABC | 19.91 ± 0.82 | 20.14 ± 0.32 | 20.19 ± 0.37 | 20.12 ± 0.41 | 20.17 ± 0.24 | |
| MCV (fL) | Laser Cyte | 71.36 ± 2.79 | 70.52 ± 3.72 | 70.74 ± 3.30 | 69.54 ± 4.82 | 68.62 ± 3.70 |
| Vet ABC | 71.4 ± 2.91 | 70 ± 2.62 | 69.8 ± 2.82 | 68.8 ± 2.35 | 68.2 ± 2.55 | |
| RDW (%) | Laser Cyte | 15.83 ± 0.93 | 15.59 ± 0.58 | 15.27 ± 0.29 | 15.59 ± 0.63 | 15.53 ± 0.41 |
| Vet ABC | 14.06 ± 0.72 | 13.75 ± 1.25 | 14.13 ± 0.49 | 14.54 ± 0.77 | 13.86 ± 1.20 | |
| PLT (K/μL) | Laser Cyte | 295.1 ± 73.96 | 326 ± 75.10 | 424.9 ± 95.08 | 420.64 ± 116.1 | 364.3 ± 142.24 |
| Vet ABC | 278.2 ± 68.82 | 289.7 ± 64.3 | 417.5 ± 150.2 | 387.96 ± 127.5 | 309.25 ± 86.30 | |
Table 3
Semi-quantitative analysis of erythrocyte morphology in five groups of dogs: A, B1, B2, C, and D
| Study group | Intensification of changes | Anisocytosis | Macrocytosis | Echinocytes | Codocytes | Dacrocytes | Keratocytes | Schistocytes | Acanthocytes | Ovalocytes | Stomatocytes | Crystallised haemoglobin |
|---|---|---|---|---|---|---|---|---|---|---|---|---|
| 2/8*, ** | 2/8 | |||||||||||
| 1+ | (25%) | 2/8 | (25%) | |||||||||
| A | 2+ | (25%) | ||||||||||
| 1/8 | ||||||||||||
| n = 8 | 3+ | (12.5%) | ||||||||||
| 4+ | ||||||||||||
| 2/8 | 1/8 | 1/8 | 2/8 | |||||||||
| 1+ | (25%) | (12.5%) | (12.5%) | (25%) | ||||||||
| 2/8 | 1/8 | 1/8 | 1/8 | |||||||||
| B1 | 2+ | (25%) | (12.5%) | (12.5%) | (12.5%) | |||||||
| 1/8 | ||||||||||||
| n = 8 | 3+ | (12.5%) | ||||||||||
| 4+ | ||||||||||||
| 1+ | 3/10 | 1/10 | 1/10 | 3/10 | 1/10 | 2/10 | ||||||
| (30%) | (10%) | (10%) | (30%) | (10%) | (20%) | |||||||
| B2 | 2+ | 1(/10 10%) | ||||||||||
| n = 10 | 3+ | |||||||||||
| 4+ | ||||||||||||
| 1+ | 15/26 *, | 6/26 | 4/26 | 7/26 | 1/26 | 4/26 | 2/26 | 1/26 | 4/26 | 1/26 | 9/26 | |
| (57.7%) | (23%) | (15.4%) | (26.9%) | (3.8%) | (15.4%) | (7.7%) | (3.8%) | (15.4%) | (3.8%) | (34.6%) | ||
| 5/26 | 1/26 | 7/26 | 2/26 | 5/26 | ||||||||
| C | 2+ | (19.2%) | (3.8%) | (26.9%) | (7.7%) | (19.2%) | ||||||
| n = 26 | 3+ | 2/26 | 2/26 | |||||||||
| (7.7%) | (7.7%) | |||||||||||
| 4+ | ||||||||||||
| 3/8 **, | 1/8 | 2/8 | 1/8 | 2/8 | 2/8 | 1/8 | 2/8 | 2/8 | 3/8 | |||
| 1+ | (37.5%) | (12.5%) | (25%) | (12.5%) | (25%) | (25%) | (12.5%) | (25%) | (25%) | (37.5%) | ||
| 1/8 | 2/8 | |||||||||||
| D | 2+ | (12.5%) | (25%) | |||||||||
| n = 8 | 3+ | |||||||||||
| 4+ | ||||||||||||
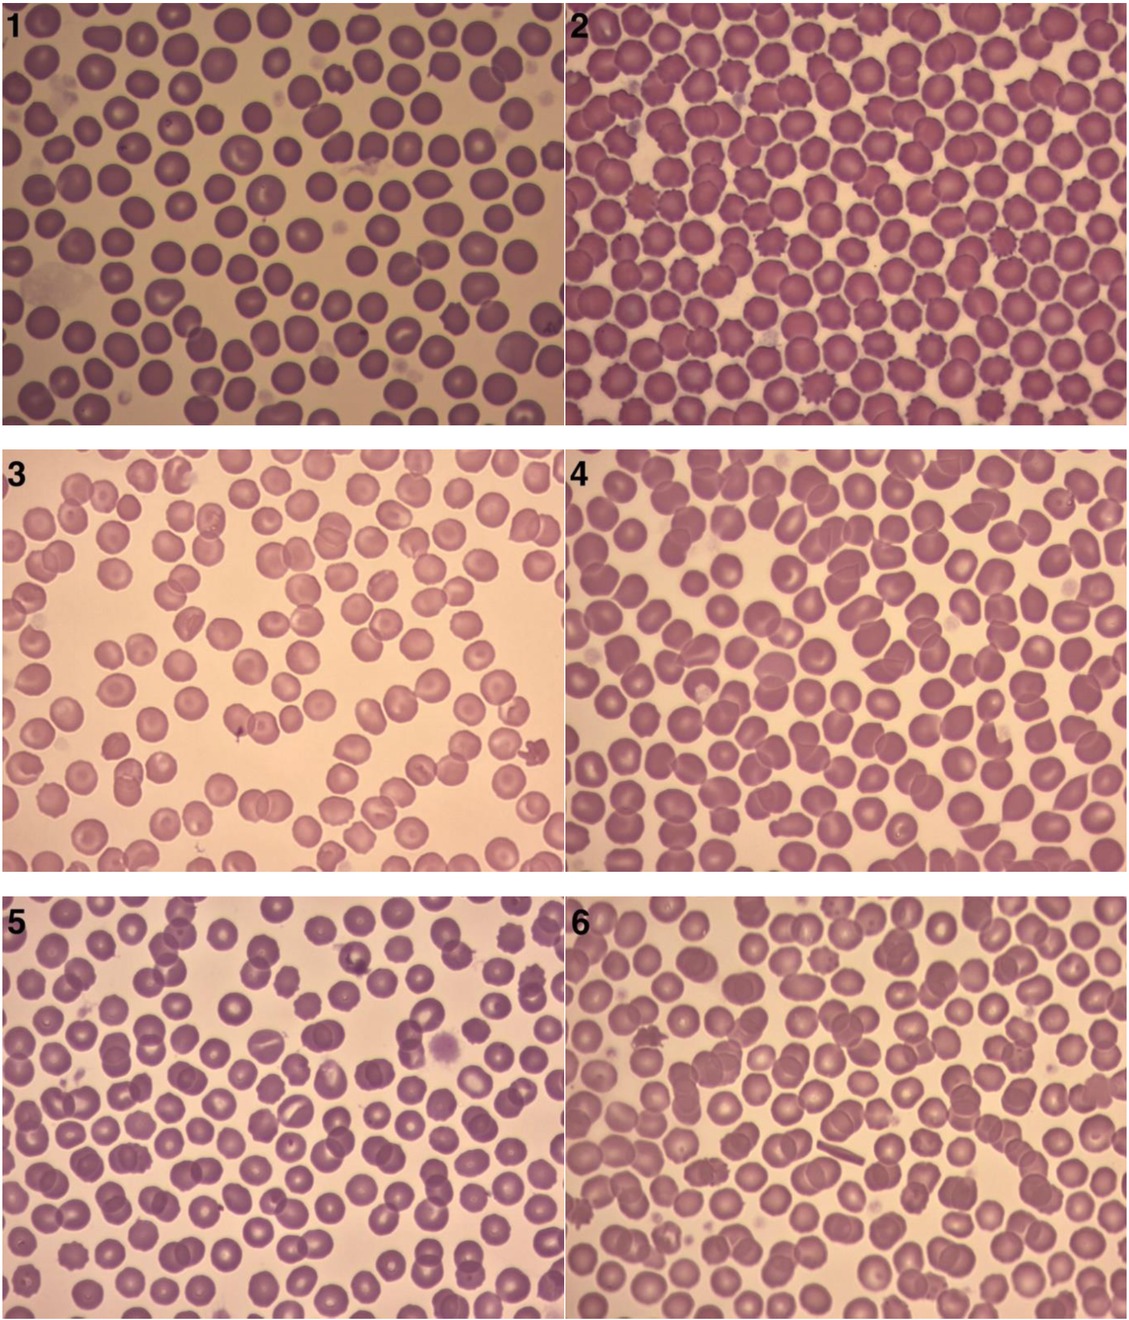
Figs 1–6
Sample blood smears representing: 1 – anisocytosis; 2 – echinocytes; 3 – codocytes; 4 – dacryocytes; 5 – stomatocytes; and 6 – crystallised haemoglobin