
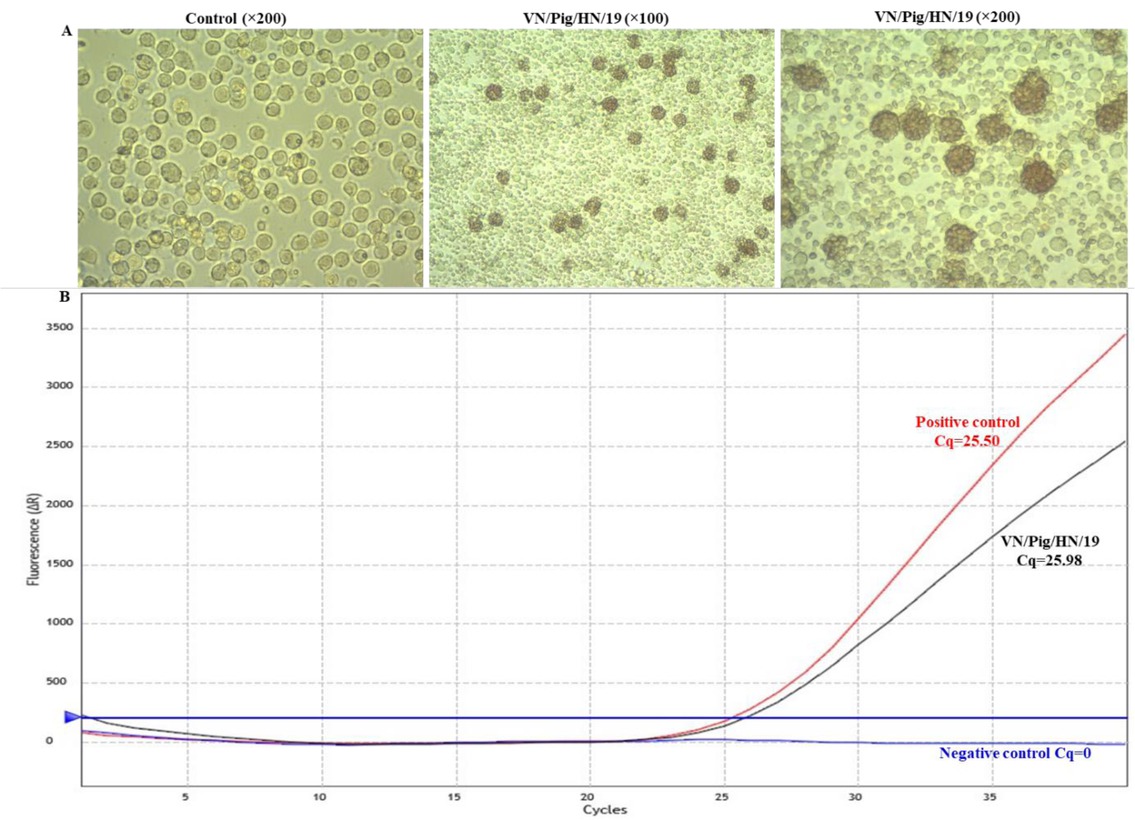
Fig. 1
Detection of ASFV in a field sample of spleen tissue. A – HAD assay of the spleen homogenate; B– the real-time PCR amplification of the p72 gene
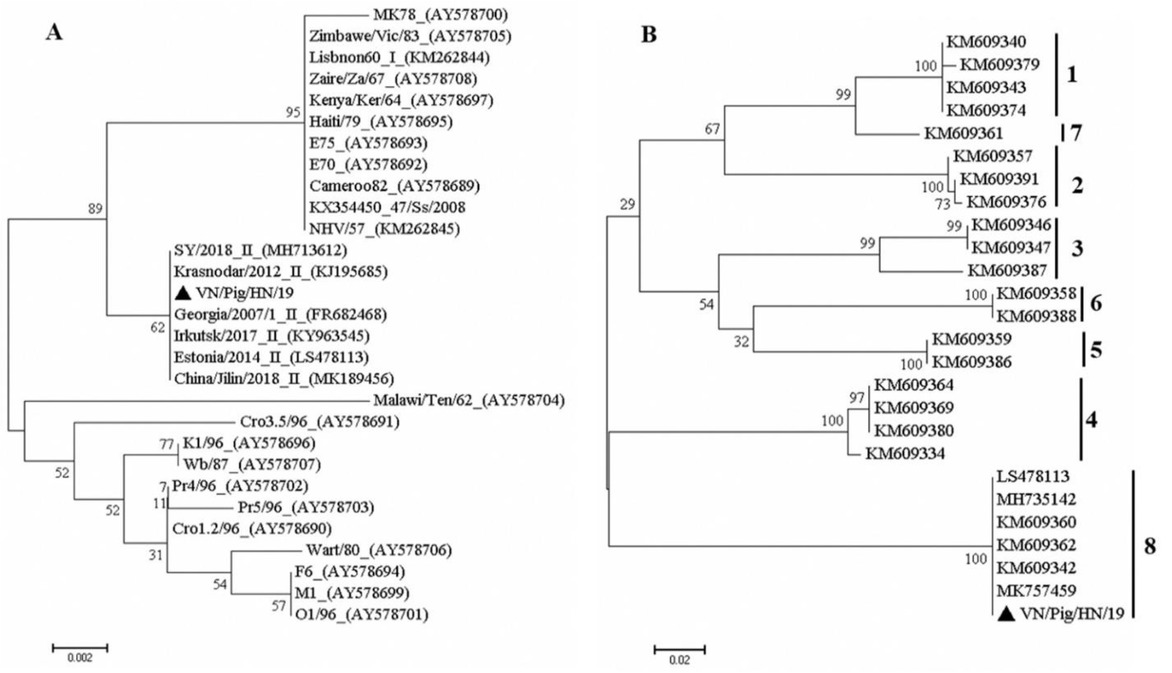
Fig. 2
Phylogenetic analysis of VN/Pig/HN/19 based on its partial p72 (A) and EP402R gene encoding the CD2v protein (B) genes. Numbers along branches indicate bootstrap values >70% (1,000 replicates). The black triangle indicates the ASFV isolate from this study. Scale bars indicate nucleotide substitutions per site
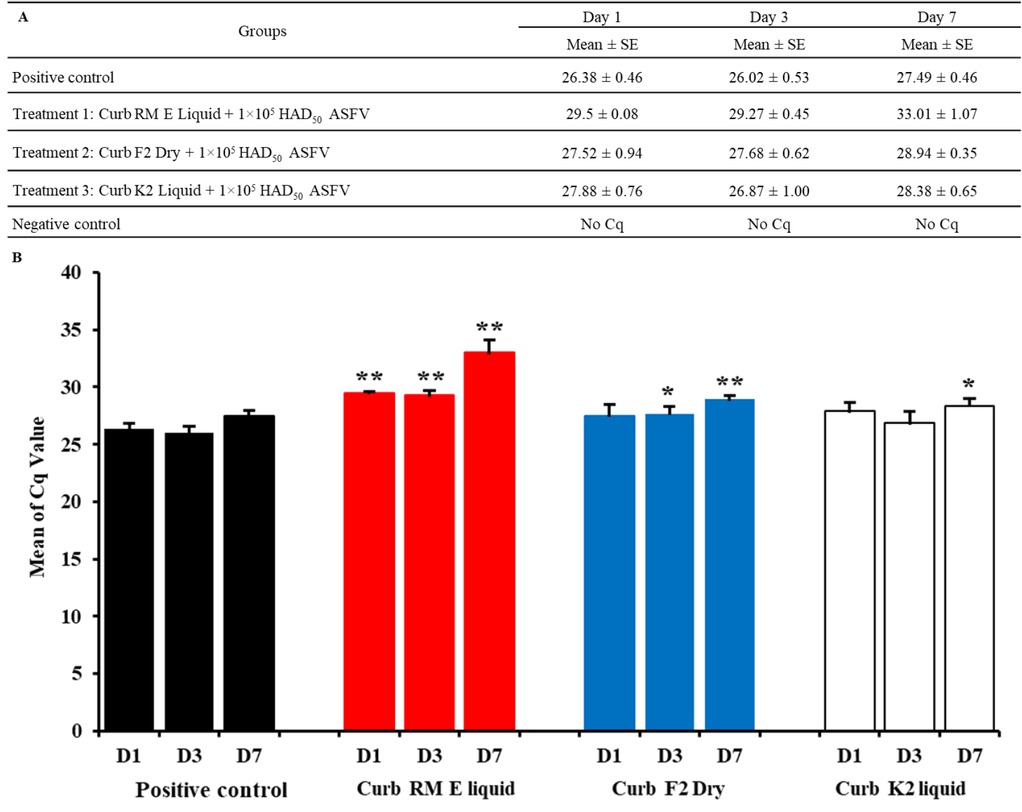
Fig. 3
(A, B). The combination of feed with the Sal CURB RM E Liquid, Sal CURB F2 Dry or Sal CURB K2 Liquid and 1×10⁵/mL HAD50 of VN/Pig/HN/19 strain one, three, and seven days post inoculation. Values represent mean and standard deviation results from three independent experiments. Significant differences compared to control are denoted by * for P < 0.05 and ** for P < 0.01
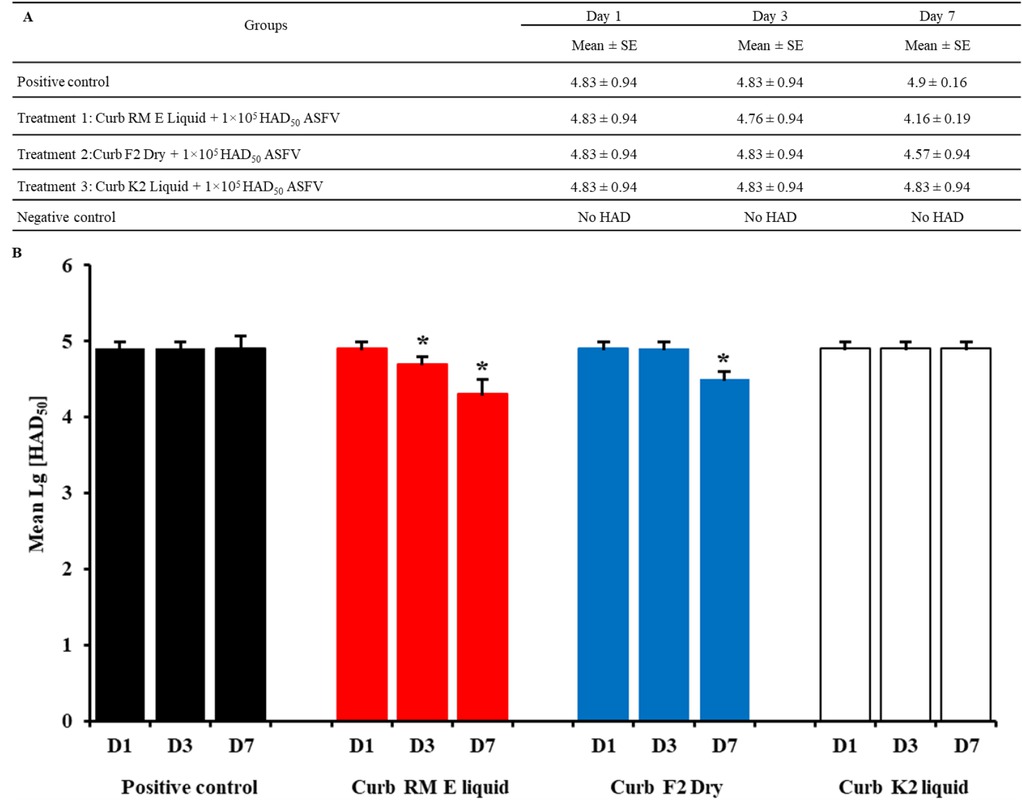
Fig. 4
(A, B). The combination of feed with the Sal CURB RM E Liquid, Sal CURB F2 Dry or Sal CURB K2 Liquid and 1×10⁵/mL HAD50 of VN/Pig/HN/19 strain one, three, and seven days post inoculation. Values represent mean and standard deviation results from three independent experiments. Significant differences compared to control are denoted by * for P < 0.05 and ** for P < 0.01