
Table 1
Primers used for real time PCR
| Primer | Sequence 5”–3” | Fragment size (bp) | GenBank accession no. |
|---|---|---|---|
| INFγ F | CTGACAAGTCAAAGCCGCAC | ||
| 137 | XM_003202048.3 | ||
| INFγ R | AGTCATTCATCTGAAGCTTGGC | ||
| GAPDH F | CCCTGAGCTCAATGGGAAGC | ||
| 125 | NM_001303179.1 | ||
| GAPDH R | TCAGCAGCAGCCTTCACTAC | ||
Table 2
Serum maternally derived anti-aMPV IgY antibody levels on the days of aMPV/A vaccination of turkeys in experiments I–IV
| Bird MDA status | Mean MDA S/P ratio ± SD at the time of vaccination | |
|---|---|---|
| 0 DOL | 14 DOL | |
| MDA+ | 6.63 ± 2.53 | 2.30 ± 1.22 |
| (experiment I) | (experiment III) | |
| MDA− | 0.00 ± 0.00 | 0.00 ± 0.00 |
| (experiment II) | (experiment IV) | |
Table 3
Mean percentage of CD4+ IFNγ+ cells ± SD within splenic mononuclear cells of turkeys of vaccinated (V) and not vaccinated (NV) groups of experiments I–IV at different DPV
| Experiment | Group | Mean percentage of CD4+IFNγ+ cells ± SD | ||
|---|---|---|---|---|
| 3 DPV | 7 DPV | 10 DPV | ||
| I | MDA+0/V | 1.11 ± 0.33 | 2.66 ± 0.97* | 3.34 ± 1.55* |
| MDA+0/NV | 1.26 ± 0.67 | 0.91 ± 0.32 | 0.97 ± 0.18 | |
| II | MDA−0/V | 2.27 ± 0.72* | 1.65 ± 1.08 | 1.01 ± 0.39 |
| MDA−0/NV | 0.94 ± 0.32 | 0.39 ± 0.11 | 0.79 ± 0.40 | |
| III | MDA+14/V | 5.21 ± 2.56* | 4.69 ± 3.69 | 4.21 ± 1.89* |
| MDA+14/NV | 1.50 ± 0.01 | 1.32 ± 0.59 | 1.16 ± 0.91 | |
| IV | MDA−14/V | 1.68 ± 0.20* | 2.71 ± 1.90 | 1.60 ± 0.52 |
| MDA−14/NV | 0.46 ± 0.28 | 1.28 ± 0.30 | 0.50 ± 0.33 | |
Table 4
Mean percentage of CD8+ IFNγ+ cells ± SD within splenic mononuclear cells of turkeys of vaccinated (V) and not vaccinated (NV) groups of experiments I–IV at different DPV
| Mean percentage of CD8+IFNγ+ cells ± SD | ||||
|---|---|---|---|---|
| Experiment | Group | 3 DPV | 7 DPV | 10 DPV |
| I | MDA+0/V | 1.14 ± 0.56 | 1.4 ± 0.36 | 5.45 ± 2.21* |
| MDA+0/NV | 0.64 ± 0.11 | 1.48 ± 0.8 | 1.21 ± 0.46 | |
| II | MDA−0/V | 2.82 ± 1.67* | 1.37 ± 0.83 | 1.17 ± 0.15 |
| MDA−0/NV | 0.5 ± 0.35 | 0.39 ± 0.02 | 1.08 ± 0.18 | |
| III | MDA+14/V | 4.26 ± 1.96 | 3.57 ± 0.42 | 3.69 ± 1.46* |
| MDA+14/NV | 1.55 ± 0.73 | 2.81 ± 0.83 | 1.39 ± 0.42 | |
| IV | MDA−14/V | 1.65 ± 0.11 | 2.79 ± 1.23 | 1.55 ± 0.89 |
| MDA−14/NV | 0.91 ± 0.16 | 2.01 ± 0.63 | 1.32 ± 0.78 | |
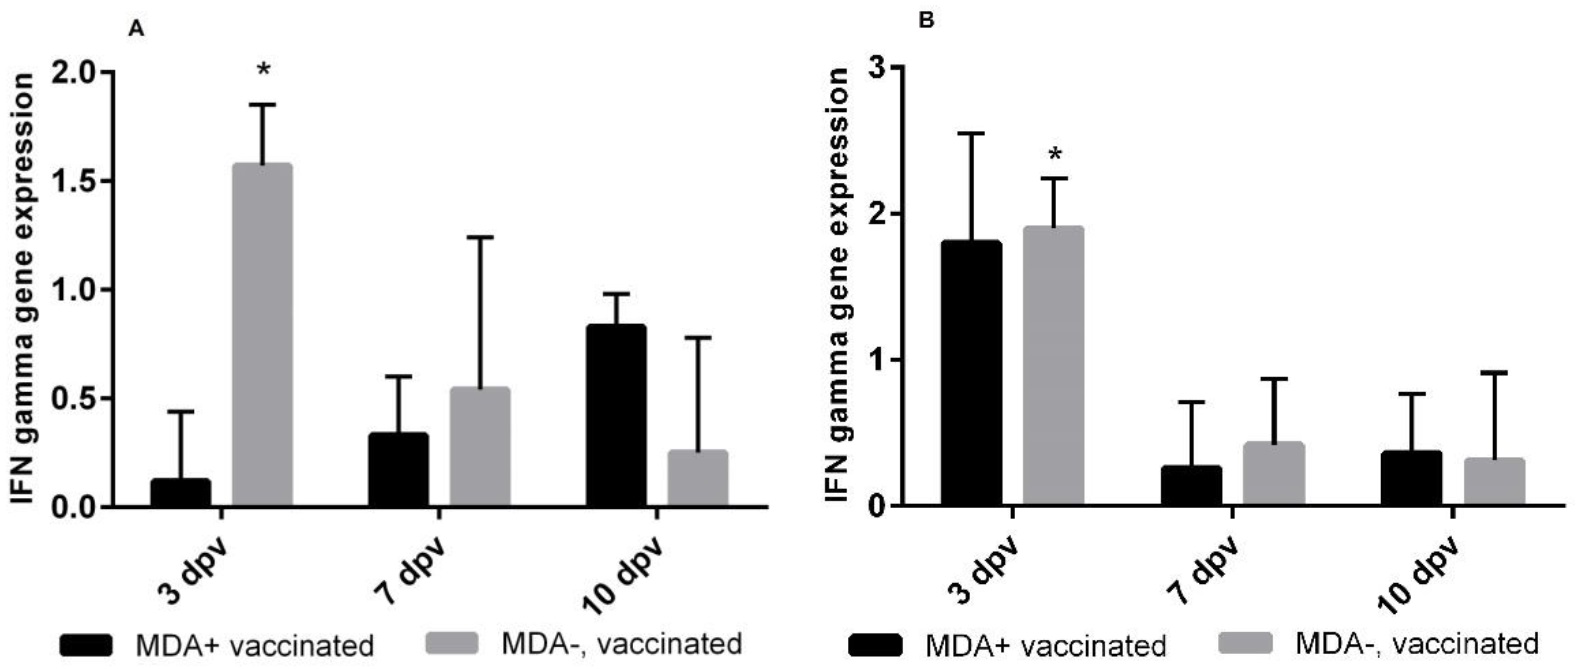
Fig. 1
Summary of mean relative IFNγ gene expression in splenic mononuclear cells on different days post aMPV/A vaccination in experiments I (MDA+ vaccinated) and II (MDA− vaccinated) (A) and III (MDA+ vaccinated) and IV (MDA− vaccinated) (B). The relative expression of the IFNγ gene was calculated using the 2−ΔΔCt method normalised to efficiency corrections, expression levels of the reference gene coding GAPDH and adequate control groups. Bars represent mean IFN gamma expression level against its expression in the adequate control group * Significant differences at different DPV (t-test, P < 0.05)
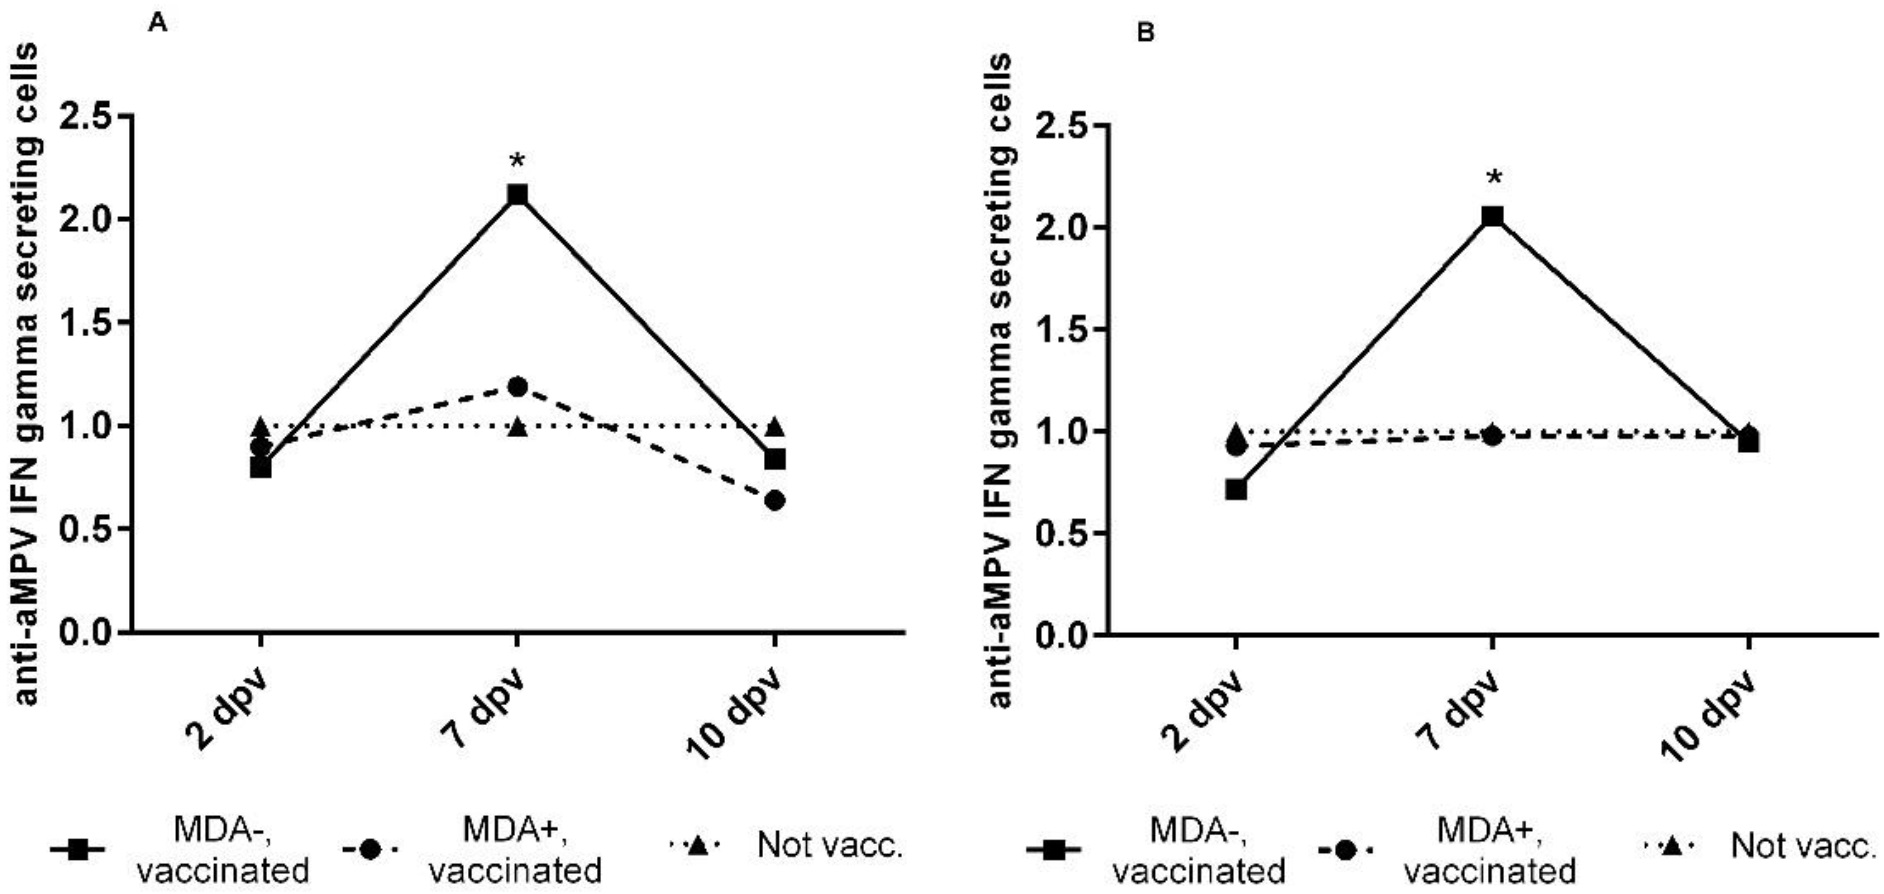
Fig. 2
Summary of mean contribution of anti-aMPV IFNγ-secreting cells within splenic mononuclear cells at different days post aMPV/A vaccination in experiments I (MDA+ vaccinated) and II (MDA− vaccinated) (A) and III (MDA+ vaccinated) and IV (MDA− vaccinated) (B) in relation to the mean contribution of anti-aMPV IFNγ-secreting cells in the spleen of adequate control birds (not vaccinated)
* Significant differences in vaccinated groups of birds in comparison to adequate control groups, at different DPV (t-test, P < 0.05)