
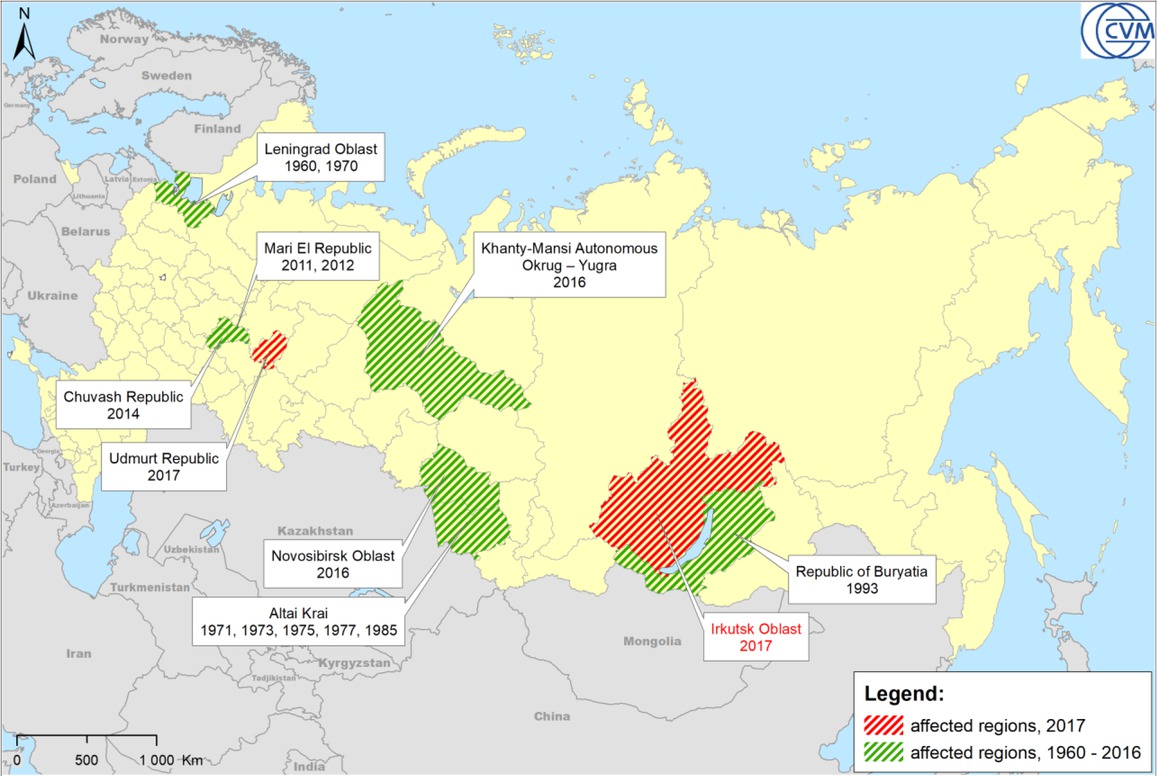
Fig. 1
Regions where MCF was recorded (1960–2017) in the USSR and Russian Federation
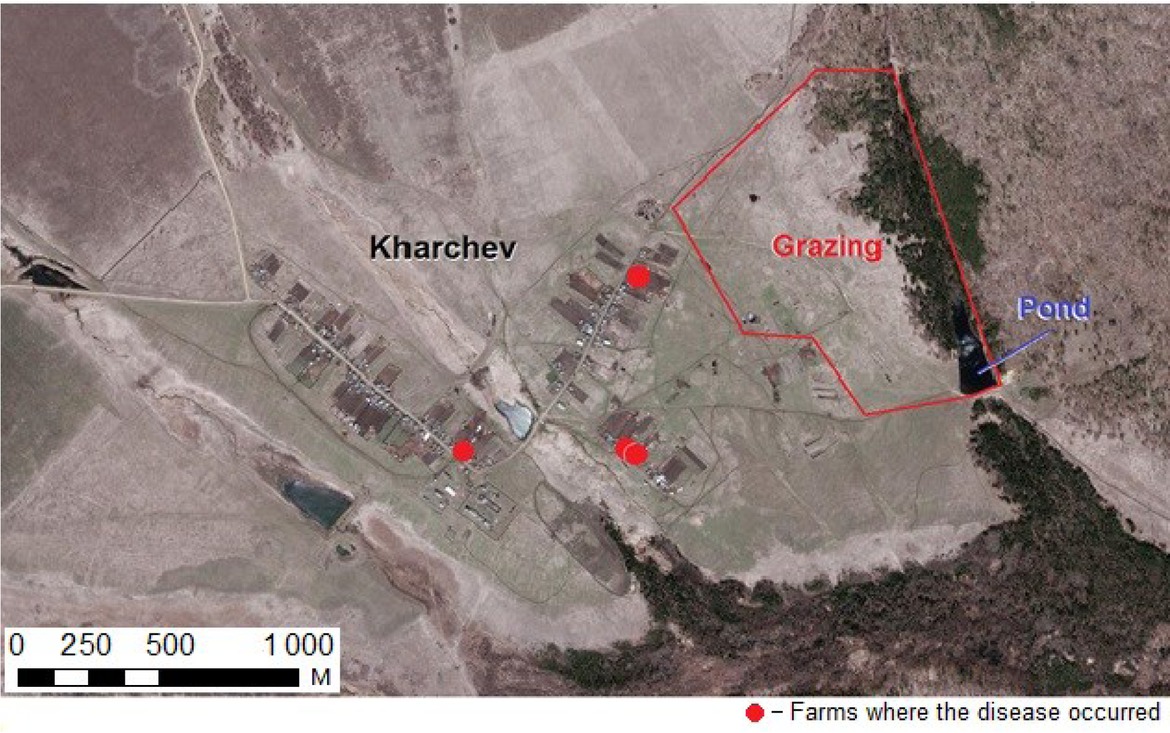
Fig. 2
MCF outbreak location in 2017
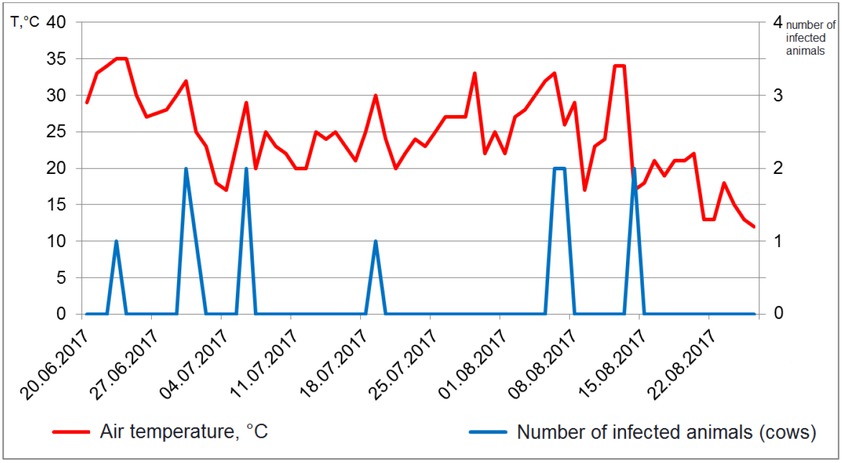
Fig. 3
Ambient temperature and number of infected animals
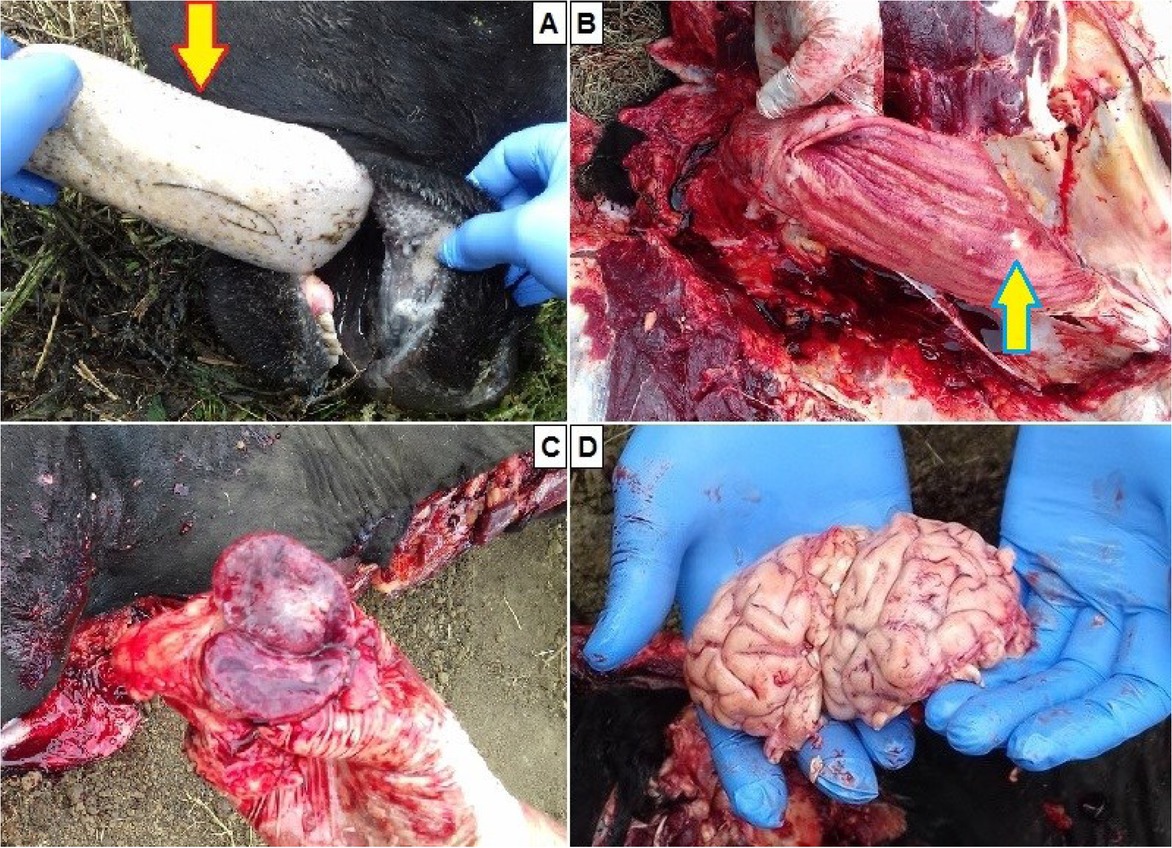
Fig. 4
Pathological changes in cattle infected with MCF: A – necrotic glossitis; B – catarrhal haemorrhagic enteritis; С – serous haemorrhagic lymphadenitis; D – petechial haemorrhages in the brain. Arrows show necrotic parts and desquamation of epithelium
Table 1
Clinical baseline characteristics and laboratory findings of cows with MCF
| Reported cases | Date of the study of blood serum | Number of diseased cows | Air temperature (°C) | Laboratory findings | ||
|---|---|---|---|---|---|---|
| Total protein (g/L) | Total calcium (mmol/L) | Reserve alkalinity (mmol/L) | ||||
| 1 | 23.06.2017 | 1 | 35 | 95.0 | 4.00 | 18.2 |
| 94.0 | 3.55 | 16.3 | ||||
| 2 | 30.06.2017 | 2 | 32 | 96.6 | 3.86 | 18.0 |
| 3 | 1.07.2017 | 1 | 32 | 84.3 | 2.84 | 23.4 |
| 97.4 | 4.23 | 18.4 | ||||
| 4 | 6.07.2017 | 2 | 29 | 86.0 | 3.00 | 20.0 |
| 5 | 19.07.2017 | 1 | 30 | 82.8 | 2.93 | 22.6 |
| 85.0 | 2.67 | 23.3 | ||||
| 6 | 6.08.2017 | 2 | 33 | 80.7 | 2.78 | 27.0 |
| 96.5 | 3.67 | 18.7 | ||||
| 7 | 7.08.2017 | 2 | 29 | 84.0 | 2.50 | 25.0 |
| 96.8 | 4.25 | 17.2 | ||||
| 8 | 14.08.2017 | 2 | 34 | 95.3 | 3.00 | 26.5 |
| M±m | 32 ± 1.00 | 90.338 ± 1.868 | 3.329 ± 0.179 | 21.123 ± 1.061 | ||
| Standard* (14) | 72.0–86.0 | 2.50–3.13 | 19.0–27.0 | |||
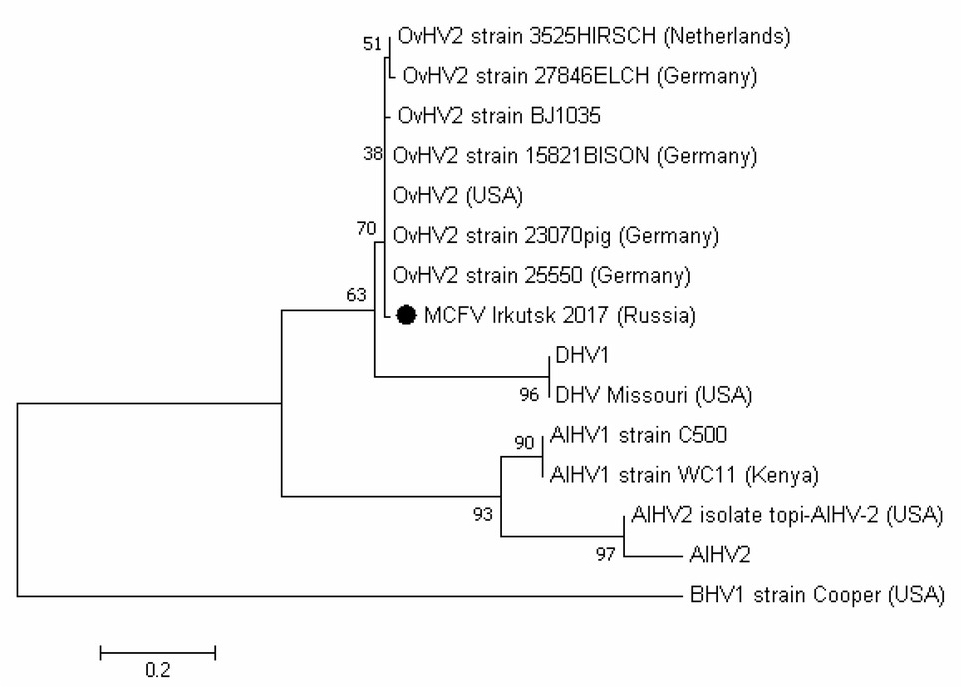
Fig. 5
Phylogenetic dendrogram on the base of polymerase gene, constructed with the help of MEGA7.0, using the neighbour-joining method