
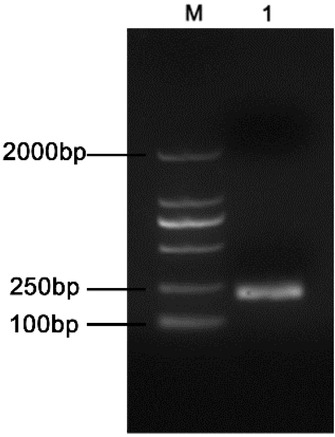
Fig. 1
The target BCSP31 fragment of PCR amplification from Brucella suis S2 strain. M – DL2000 DNA Marker (TaKaRa Bio); lane 1 – DNA fragment of PCR amplification
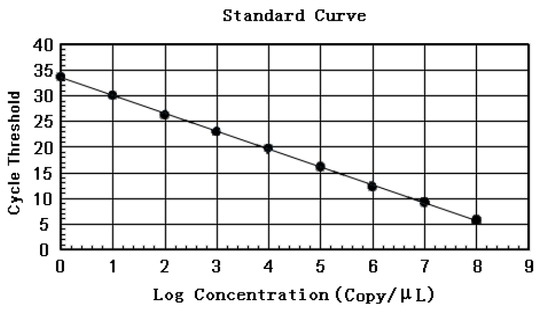
Fig. 2
The standard curve for calculating Brucella concentration according to CT of qPCR based on the template of recombinant standard plasmid pMD-18T-BCSP31
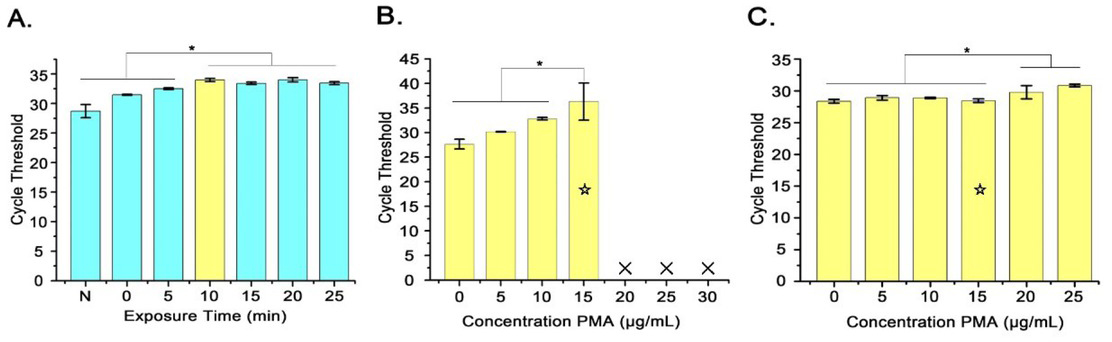
Fig. 3
Optimisation of PMA treatment conditions. A – Effect of different exposure time on qPCR amplification; B – Different concentrations of PMA treating dead bacteria; C – Different concentrations of PMA treating viable bacteria; * – P < 0.05; Yellow columns – optimal PMA treatment time of 10 min; Yellow columns with ☆ – optimal PMA treatment concentration of 15 μg/mL; × – not detected
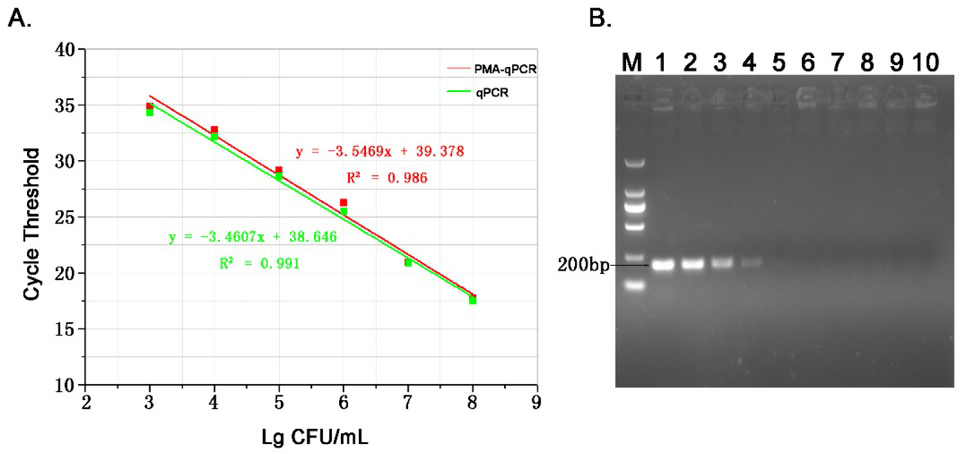
Fig. 4
The sensitivity of detecting B. suis S2 strain. A – sensitivity by the PMA-qPCR; B – sensitivity by the conventional PCR, comprising M – DL2000 DNA Marker; lanes 1–10 – 108 – 10-1 CFU/mL
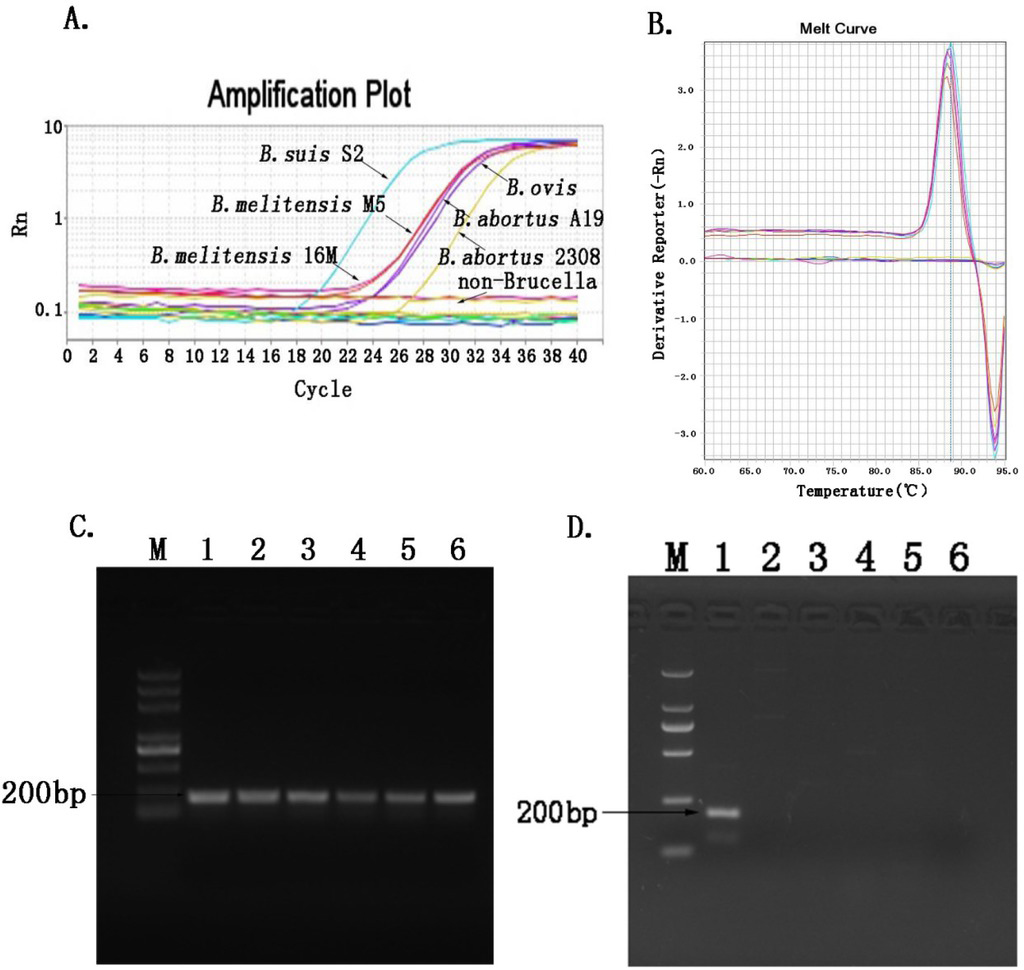
Fig. 5
Analysis of the specificity of PMA-qPCR. A – amplification plot; B – melting curves of the qPCR amplification product; C – agarose gel electrophoresis of different Brucella species detected by the normal PCR, comprising M – DL5000 DNA Marker; lane 1 – B. suis S2; lane 2 – B. abortus 2308; lane 3 – B. abortus A19; lane 4 – B. melitensis M5; lane 5 – B. melitensis 16M; and lane 6 – B. ovis; D – agarose gel electrophoresis of species other than Brucella amplified by the conventional PCR, comprising M – DL2000 DNA Marker; lane 1 – B. suis S2; lane 2 – E. coli; lane 3 – S. typhimurium; lane 4 – Y. enterocolitica; lane 5 – V. parahaemolyticus; and lane 6 – RNase-free water
Table 1
Coefficient of variation for intra- and inter-batch experiments
| DNA dilution times | Intra-assay | Inter-assay | ||||
|---|---|---|---|---|---|---|
| Average value of CT | SD | CV | Average value of CT | SD | CV | |
| 107 | 17.55277 | 0.13205 | 0.75 | 17.95203 | 0.26862 | 1.50 |
| 106 | 21.9137 | 0.26965 | 1.23 | 22.35123 | 0.45614 | 2.04 |
| 105 | 23.80697 | 0.15085 | 0.63 | 23.82857 | 0.43607 | 1.83 |
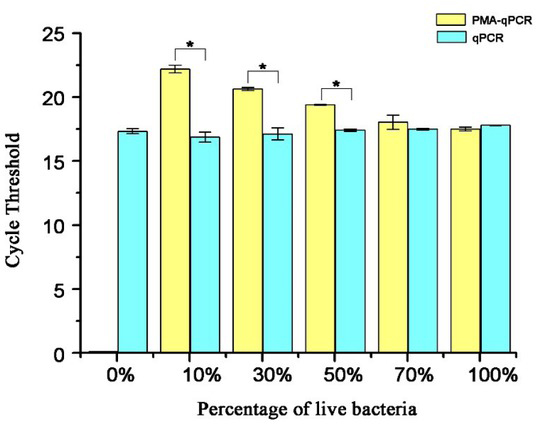
Fig. 6
Analysis of different ratios of viable to dead B. suis S2 strain using the PMA-qPCR method and the qPCR method. * – P < 0.05
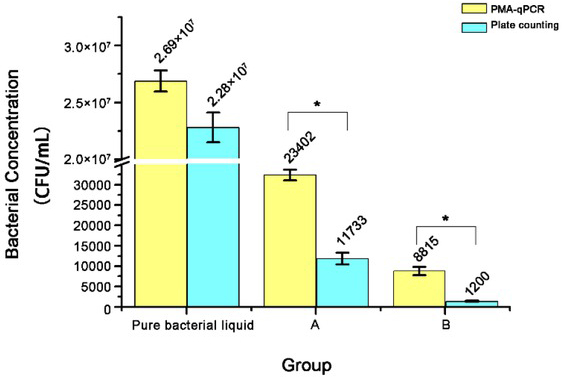
Fig. 7
Determination of the amount of the viable B. suis S2 strain by PMA-qPCR and plate counting methods. Pure bacterial liquid – B. suis cultured in TSB; A – B. suis harbouring in mouse macrophage RAW 264.7 cells infected with 1.28 × 10¹² CFU/mL of B. suis S2 strain; B – B. suis harbouring in mouse macrophage RAW 264.7 cells infected with 0.64 × 10¹² CFU/mL of B. suis S2 strain; * P < 0.05