
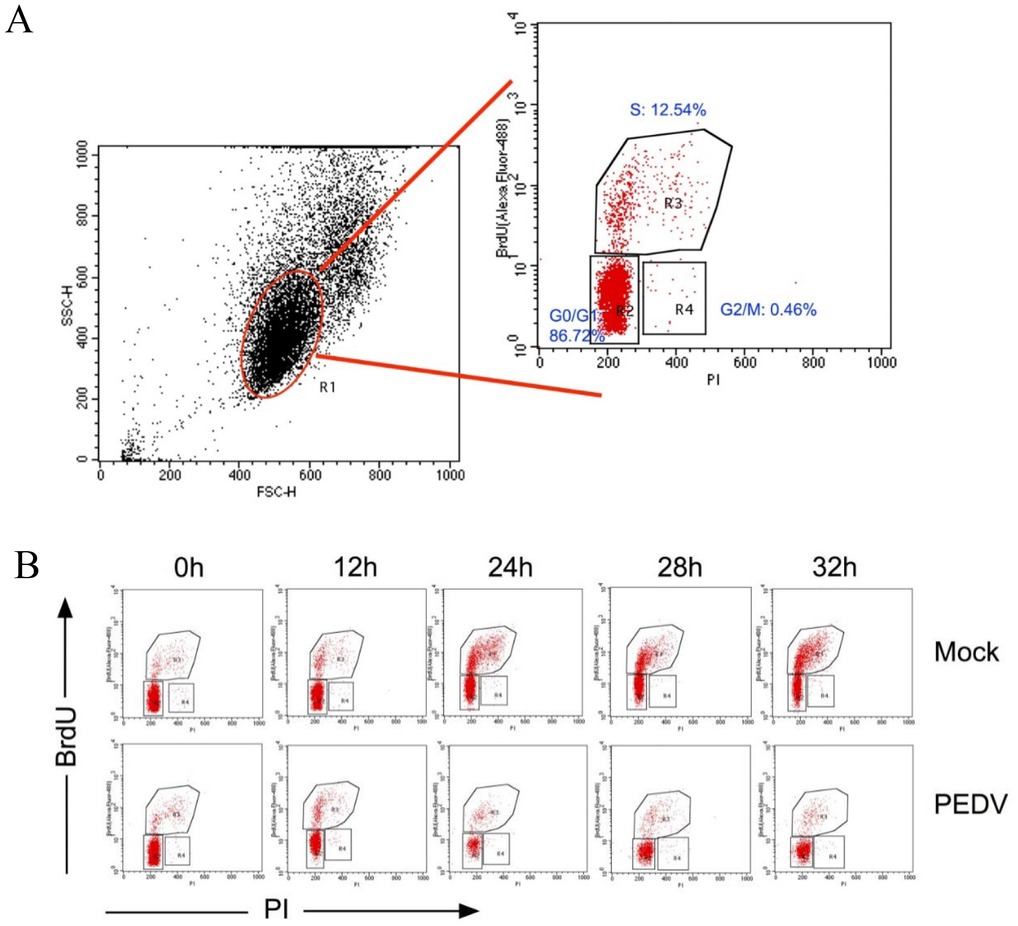
Fig. 1
A – analysis workflow for flow cytometry data; B – changes in cell cycle of Vero cells infected with PEDV between 0 h and 32 h after infection
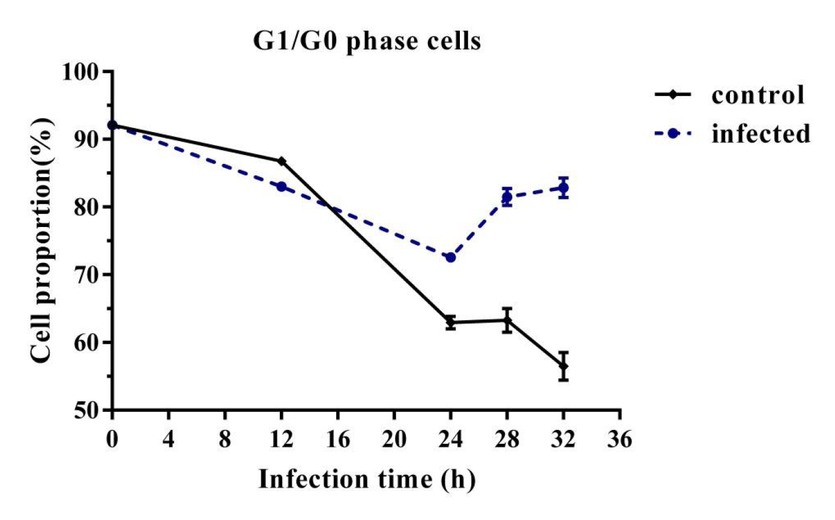
Fig. 2
changes in proportion of cells in the G1/G0 phase of Vero cells infected with PEDV between 0 h and 32 h after infection
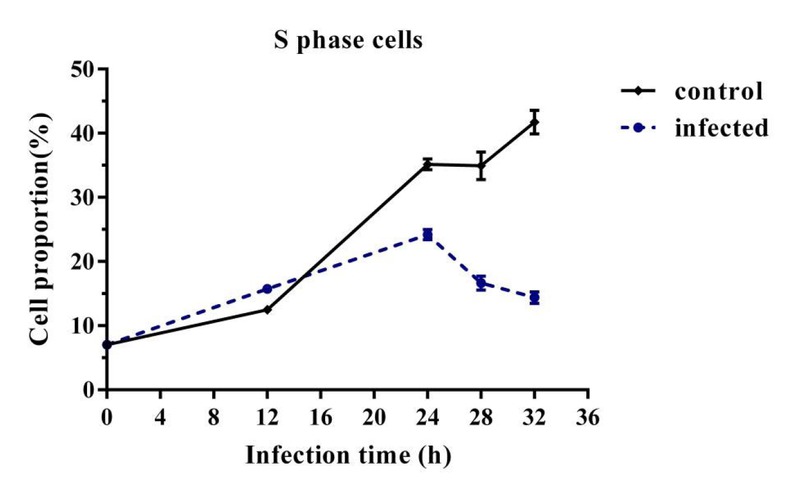
Fig. 3
Changes in proportion of cells in the S phase of Vero cells infected with PEDV between 0 h and 32 h after infection
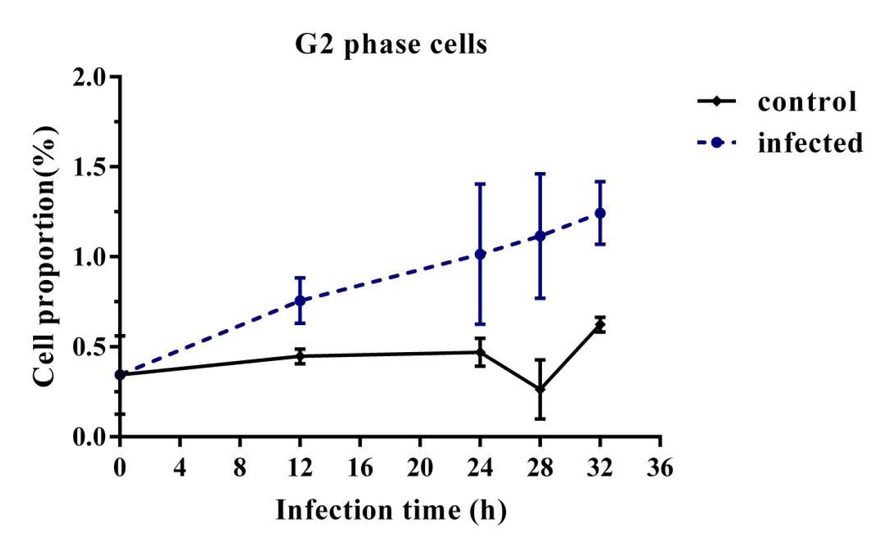
Fig. 4
Changes in proportion of cells in the G2/M phase of Vero cells infected with PEDV between 0 h and 32 h after infection
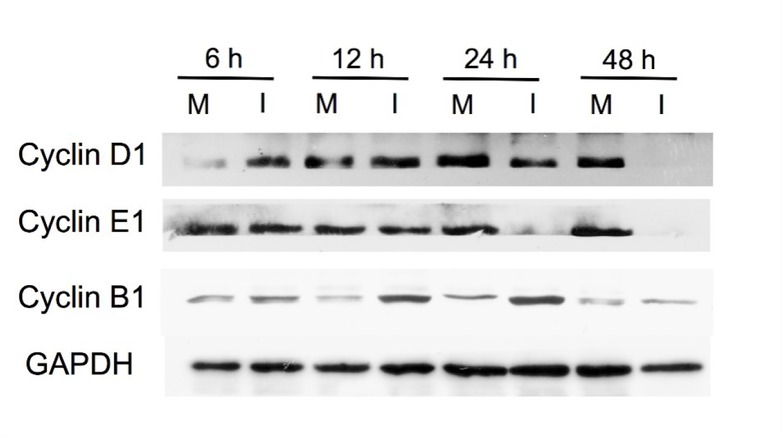
Fig. 5
Changes over time in Cyclin B1, D1, and E1 in Vero cells infected with PEDV (M – control; I – PEDV infected cells)
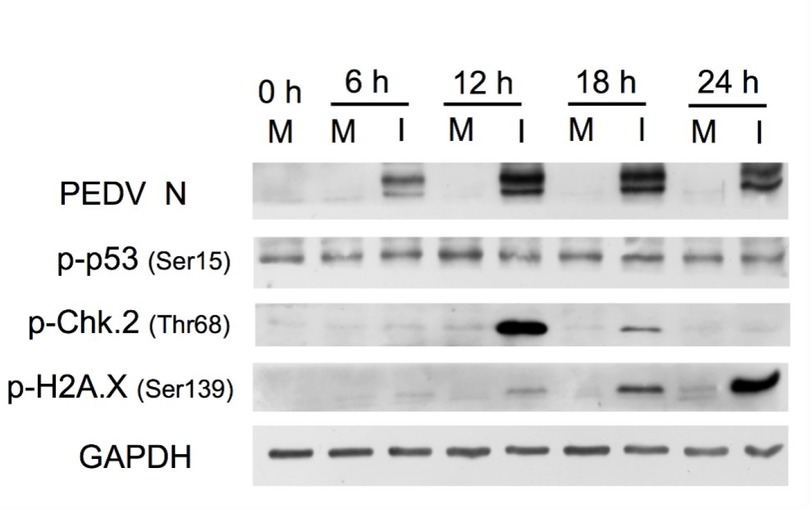
Fig. 6
Changes over time in Chk.2, H2A.X, p53, and PEDV-N in Vero cells infected with PEDV (M – control, I – PEDV infected cells)
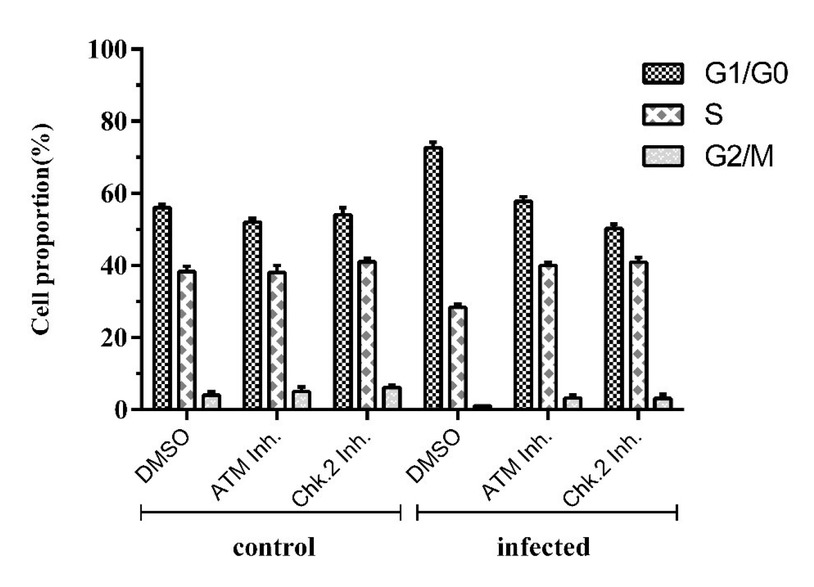
Fig. 7
Cell cycle data of control or PEDV-infected Vero cells treated by DMSO, ATM inhibitor, or/ and Chk.2 inhibitor
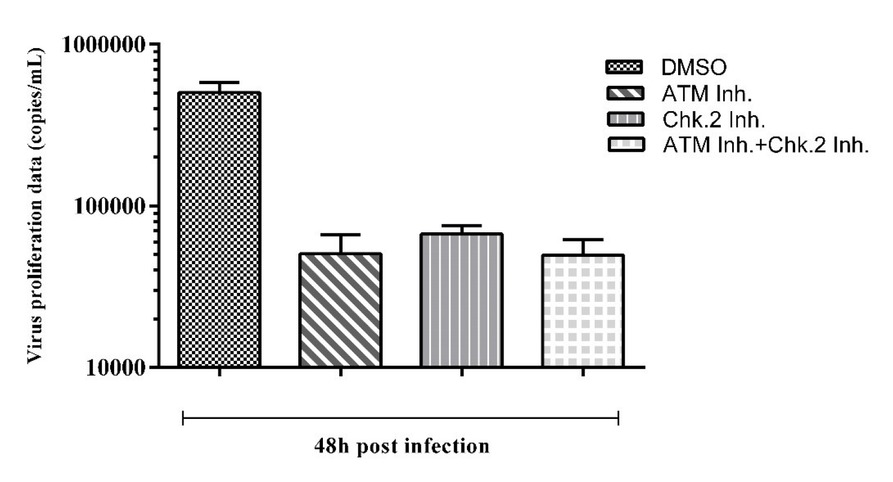
Fig. 8
Virus proliferation evaluated by real-time PCR of control or PEDV infected Vero cells treated by DMSO, ATM inhibitor or Chk.2 inhibitor