
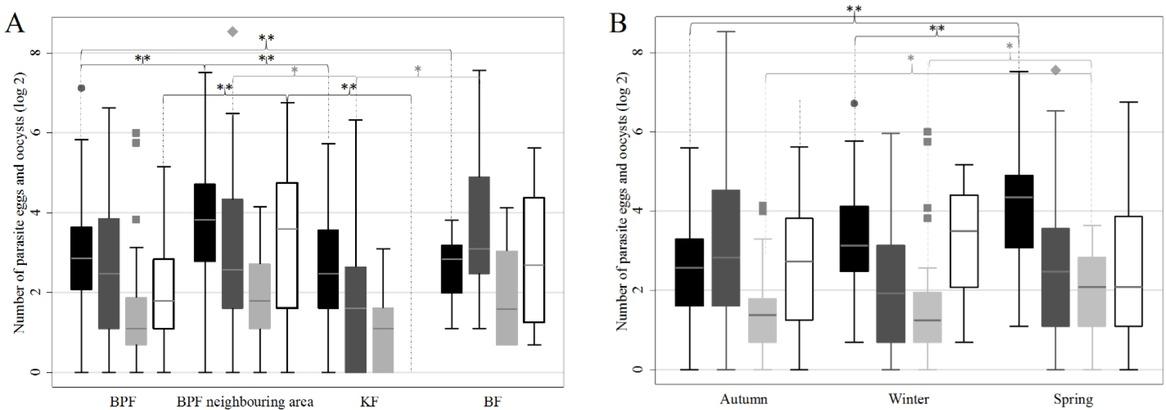
Fig. 1
Cross-correlations between the explanatory variables and outcomes – prevalence and intensity of invasion
| Origin | Season | Trichostrongylidae | Aonchotheca sp. | Nematodirus spp. | Strongyloides spp. | Trichuris sp. | Moniezia spp. | Eimeria spp. | Fasciola hepatica | Dictyocaulus viviparus | ||
|---|---|---|---|---|---|---|---|---|---|---|---|---|
| Origin | 1 | - | 27.1 – P <0.001; | 68.5 – P <0.001; | 33.2 – P <0.001; | 7.3 | 22.9 – P <0.001; | 12.0 – P value between 0.05 and 0.001; | 92.3 – P <0.001; | 37.2 – P <0.001; | 86.4 – P <0.001; | |
| Season | 72.1 – P <0.001; | 1 | 102.1 – P <0.001; | 4.5 | 6.0 | 1.9 | 12.0 – P value between 0.05 and 0.001; | 15.0 – P <0.001; | 3.2 | 13.4 – P value between 0.05 and 0.001; | 56.4 – P <0.001; | |
| Trichostron- gylidae | 0.73 | 7.9 – P value between 0.05 and 0.001; | 1 | 0.15 – P value between 0.05 and 0.001; | 0.22 – P <0.001; | −0.09 | 0.29 – P <0.001; | 0.27 – P <0.001; | 0.13 – P value between 0.05 and 0.001; | 0.25 – P <0.001; | 0.38 – P <0.001; | Intensity of invasion (number of eggs/oocysts/larvae) |
| Aonchotheca sp. | 74.4 – P <0.001; | 3.2 | 5.8 – P value between 0.05 and 0.001; | 1 | 0.11 | −0.07 | 0.10 | 0.07 | 0.38 – P <0.001; | 0.16 – P value between 0.05 and 0.001; | 0.15 – P value between 0.05 and 0.001; | |
| Nematodirus spp. | 32.6 – P <0.001; | 5.9 – P value between 0.05 and 0.001; | 1.6 | 7.0 – P value between 0.05 and 0.001; | 1 | −0.02 | 0.46 – P <0.001; | 0.35 – P <0.001; | 0.16 – P value between 0.05 and 0.001; | 0.22 – P <0.001; | 0.26 – P <0.001; | |
| Strongyloides spp. | 7.3 | 2.0 | 0.2 | 2.1 | 0.2 | 1 | −0.03 | −0.03 | −0.06 | −0.08 | −0.06 | |
| Trichuris sp. | 22.5 – P <0.001; | 11.9 – P value between 0.05 and 0.001; | 1.6 | 4.1 – P value between 0.05 and 0.001; | 74.9 – P <0.001; | 0.2 | 1 | 0.47 – P <0.001; | 0.15 – P value between 0.05 and 0.001; | 0.22 – P <0.001; | 0.29 – P <0.001; | |
| Moniezia spp. | 11.9 – P value between 0.05 and 0.001; | 14.7 – P value between 0.05 and 0.001; | 1.9 | 0.8 | 41.6 – P <0.001; | 0.3 | 71.2 – P <0.001; | 1 | 0.09 | 0.15 – P value between 0.05 and 0.001; | 0.20 – P <0.001; | |
| Eimeria spp. | 7.4 | 12.5 – P value between 0.05 and 0.001; | 0.06 | 35.6 – P <0.001; | 5.8 – P value between 0.05 and 0.001; | 1.1 | 4.5 – P value between 0.05 and 0.001; | 4.7 – P value between 0.05 and 0.001; | 1 | 0.01 | 0.04 | |
| Fasciola hepatica | 27.7 – P <0.001; | 3.0 | 2.3 | 3.7 – P value between 0.05 and 0.001; | 5.1 – P value between 0.05 and 0.001; | 1.2 | 5.6 – P value between 0.05 and 0.001; | 2.6 | 1.0 | 1 | 0.33 – P <0.001; | |
| Dictyocaulus viviparus | 81.7 – P <0.001; | 59.2 – P <0.001; | 0.6 | 11.7 – P value between 0.05 and 0.001; | 16.0 – P <0.001; | 1.2 | 22.1 – P <0.001; | 9.6 – P value between 0.05 and 0.001; | 2.3 | 18.2 – P <0.001; | 1 | |
| Prevalence (presence/absence of parasite) | ||||||||||||
The numbers of different gastro-intestinal nematodes, Fasciola hepatica eggs, Dictyocaulus viviparus larvae, and Eimeria spp_ oocysts and the parasite prevalence in European bison from the Białowieża Forest (n = 139) and its neighbouring area (n = 96) and the Knyszyńska (n = 107) and Borecka (n = 26) Forests collected in the autumns of 2014 and 2015 (n = 223), winter 2016 (n = 51), and spring 2015 (n = 94)
| Parasite species (adult gastro-intestinal nematodes except where noted) | Variables | |||||||
|---|---|---|---|---|---|---|---|---|
| Origin | Season | |||||||
| Białowieża Forest (BiF) | BiF neighbouring area | Knyszyńska Forest | Borecka Forest | Autumn | Winter | Spring | ||
| Trichostrongylidae | n – mean of egg numbers per 3 g of faeces; | 37.9 | 98.2 | 25.1 | 14.1 | 14.2 | 43 | 131.9 |
| (range) | (1–1150) | (1–1196) | (1–305) | (1–45) | (1–98) | (1–448) | (1–1196) | |
| % – standard deviation; | 95.7 | 93.7 | 94.4 | 92.3 | 92 | 100 | 98 | |
| (SD – % mean prevalence; | (20.4) | (24.3) | (23.1) | (27.2) | (27.3) | (0) | (14.5) | |
| Aonchotheca spp. | n – mean of egg numbers per 3 g of faeces; | 5.3 | 4.2 | 1.3 | 6.2 | 3.8 | 2 | 3.1 |
| (range) | (1–82) | (1–58) | (1–8) | (1–28) | (1–82) | (1–20) | (1–79) | |
| % – standard deviation; | 54.7 | 59.4 | 7.4 | 34.6 | 43.5 | 43.1 | 32.9 | |
| (SD – % mean prevalence; | (50) | (49.4) | (26.4) | (48.5) | –49.7 | (50) | (47.2) | |
| Nematodirus spp. | n – mean of egg numbers per 3 g of faeces; | 0.06 | 1.1 | 0.02 | 0.1 | 1 | 0.4 | |
| (range) | (1–4) | (1–24) | (1–1) | 0 | (1–13) | (1–24) | (1–10) | |
| % – standard deviation; | 3.6 | 19.8 | 1.9 | 4.5 | 9.8 | 11.7 | ||
| (SD – % mean prevalence; | (18.7) | (40) | (13.6) | 0 | (20.7) | (30) | (32.3) | |
| Strongyloides spp. | n – mean of egg numbers per 3 g of faeces; | 0.1 | 0.05 | |||||
| (range) | 0 | 0 | (1–5) | 0 | (1–5) | 0 | 0 | |
| % – standard deviation; | 2.8 | 1.3 | ||||||
| (SD – % mean prevalence; | 0 | 0 | (16.6) | 0 | (11.5) | 0 | 0 | |
| Trichuris spp. | n – mean of egg numbers per 3 g of faeces; | 2.1 | 19.8 | 0.6 | 1.7 | 10.3 | 14.3 | |
| (range) | (1–152) | (1–305) | (1–61) | 0 | (1–136) | (1–249) | (1–305) | |
| % – standard deviation; | 5.8 | 17.7 | 1.9 | 3.6 | 11.8 | 13.8 | ||
| (SD – % mean prevalence; | (23.3) | (38.4) | (13.6) | 0 | (18.6) | (32.5) | (34.7) | |
| Moniezia spp. | n – mean of egg numbers per 3 g of faeces; | 1.7 | 14.3 | 4.5 | 2.1 | 6.5 | 14 | |
| (range) | (1–142) | (1–304) | (1–267) | 0 | (1–267) | (1–142) | (0–304) | |
| % – standard deviation; | 8.6 | 15.6 | 3.7 | 4 | 17.6 | 13.8 | ||
| (SD – % mean prevalence; | (28.2) | (36.5) | (19.1) | 0 | (19.7) | (38.5) | (34.7) | |
| Eimeria spp. (oocysts) | n – mean of oocyst numbers per 5 g of faeces | 45.4 | 99.2 | 10.8 | 160.6 | 65.9 | 27.5 | 53.8 |
| (range) | (1–748) | (1–5072) | (1–557) | (1–1914) | (1–5072) | (1–391) | (1–1917) | |
| % – mean of oocyst numbers per 5 g of faeces | 74.8 | 77.1 | 25.2 | 96.1 | 56 | 82.3 | 65.9 | |
| (SD – % mean prevalence; | (43.5) | (42.2) | (43.6) | (19.6) | (49.7) | (38.5) | (47.6) | |
| Fasciola hepatica (eggs) | n – mean of egg numbers per 3 g of faeces; | 8.7 | 8.7 | 2.4 | 5.3 | 3.5 | 18.3 | 7.5 |
| (range) | (1–403) | (1–63) | (1–22) | (1–62) | (1–63) | (1–403) | (1–38) | |
| % – standard deviation; | 69.1 | 78.1 | 53.3 | 30.8 | 62.3 | 58.8 | 71.3 | |
| (SD – % mean prevalence; | (46.4) | (41.6) | (50.1) | (47.1) | (48.5) | (49.7) | (45.5) | |
| Dictyocaulus viviparus (larvae) | n – mean of egg numbers per 3 g of faeces; | 5 | 49.8 | 28.4 | 6 | 20.7 | 40.6 | |
| (range) | (1–173) | (1–856) | 0 | (1–276) | (1–276) | (1–176) | (1–856) | |
| % – standard deviation; | 26.6 | 55.2 | 46.1 | 14.4 | 33.3 | 56.4 | ||
| (SD – % mean prevalence; | (44.3) | (50) | 0 | (50.8) | (35.1) | (47.6) | (49.8) | |
Mixed-effects generalised linear model (GLM) coefficients for the effects of season and origin on the probability of European bison of being infected with individual parasites
| Origin (forest) | Season | ||||||||
|---|---|---|---|---|---|---|---|---|---|
| BiF | BiF | KnF | BoF | Autumn | Winter | Spring | Intercept | ||
| Aonchotheca sp. | |||||||||
| Coefficient β | 0.22 | −2.96 | −0.79 | −0.90 | −0.84 | 0.58 | |||
| Trichuris sp. | |||||||||
| Coefficient β | 1.20 | −0.95 | 0 | 1.13 | 1.30 | −3.47 | |||
| Dictyocaulus viviparus | |||||||||
| Coefficient β | 1.05 | 0 | 0.21 | 0.75 | 2.29 | −1.67 | |||
The numbers of faecal samples collected by location and season
| Season | Location | ||||
|---|---|---|---|---|---|
| Borecka Forest | Knyszyńska Forest | Białowieża Forest | BiF neighbouring region | Total | |
| Autumn 2014 | 12 | 18 | 78 | 50 | 158 |
| Autumn 2015 | 0 | 65 | 0 | 0 | 65 |
| Spring 2015 | 14 | 24 | 20 | 36 | 94 |
| Winter 2016 | 0 | 0 | 41 | 10 | 51 |
| Total | 26 | 107 | 139 | 96 | 368 |
Mixed-effect generalised linear model (GLM) coefficients for the effects of season and origin on the intensity of individual parasite invasion in European bison
| Origin (forest) | Season | ||||||||
|---|---|---|---|---|---|---|---|---|---|
| BiF | BiF | KnF | BoF | Autumn | Winter | Spring | Intercept | ||
| Trichostrongylidae | |||||||||
| Coefficient β | 0.50 | −0.48 | −1.7 | 0.95 | 2.16 | 2.69 | |||
| Aonchotheca sp. | |||||||||
| Coefficient β | −0.34 | −3.10 | −0.75 | −1.18 | −0.23 | 1.94 | |||
| Nematodirus spp. | |||||||||
| Coefficient β | 3.33 | −0.25 | −12.55 | 2.05 | 0.53 | −3.87 | |||
| Trichuris sp. | |||||||||
| Coefficient β | 2.18 | −0.82 | −16.49 | 1.76 | 1.71 | −0.36 | |||
| Moniezia spp. | |||||||||
| Coefficient β | 1.95 | 1.21 | −16.1 | 1.51 | 1.74 | −0.43 | |||
| Eimeria spp. | |||||||||
| Coefficient β | 0.76 0.02 | −1.62 | 1.25 | −0.99 | −0.59 | 4.10 | |||
| Fasciola hepatica | |||||||||
| Coefficient β | 0.20 | −0.77 | −0.16 | 1.42 | 0.65 | 1.44 | |||
| Dictyocaulus viviparus | |||||||||
| Coefficient β | 2.21 | −19.31 | 1.54 | 1.26 | 1.40 | 0.82 | |||