
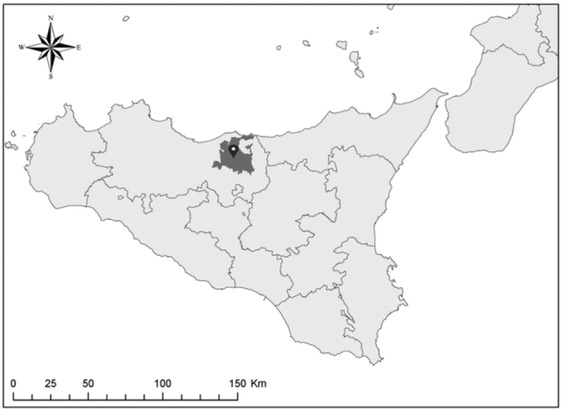
Fig. 1
Geographical area where the farms are located
Table 1
Nucleotide sequences of primers and hydrolysis probe to amplification of lipL32 gene
| Oligonucleotide | Sequence 5′–3′ |
|---|---|
| Primer F | GGTCTTTACACAATTTCTTTCACT |
| Primer R | TGGGAAAAGCAGACCAACAGA |
| Probe | AAGTGAAAGGATCTTTCGTTGTTGC |
Table 2
Serum samples of cows on the farm A by microscopic agglutination test (MAT) with cut-off of ≥100 (n = 23). * <100 negative samples
| Positive samples (n = 23) | Antibody titre T0 | Antibody titre T1 | Antibody titre T2 |
|---|---|---|---|
| 1 | 400 | 200 | <100* |
| 2 | 400 | <100* | <100* |
Table 3
Positive serum samples of cows on farm B by microscopic agglutination test (MAT) with cut-off of ≥100 (n = 75). * <100 negative samples. ** New positive samples found at T1
| (n = 75) | T0 | T1 | T2 | T3 |
|---|---|---|---|---|
| 1 | 1,600 | 800 | 800 | <100 |
| 2 | 100 | 100 | <100* | <100 |
| 3 | 1,600 | 3,200 | 1,600 | <100 |
| 4 | 800 | 800 | 400 | <100 |
| 5 | 100 | 100 | <100* | <100 |
| 6 | 400 | 800 | 800 | <100 |
| 7 | 100 | 200 | <100* | <100 |
| 8 | 100 | 100 | <100* | <100 |
| 9 | 200 | 200 | <100* | <100 |
| 10 | 100 | 100 | <100* | <100 |
| 11 | 800 | 400 | 400 | <100 |
| 12 | 800 | 800 | <100* | <100 |
| 13 | 1,600 | 800 | 400 | <100 |
| 14 | 400 | 800 | 400 | <100 |
| 15 | 100 | 100 | <100* | <100 |
| 16 | 800 | 800 | 800 | <100 |
| 17 | 800 | 1,600 | 1,600 | <100 |
| 18 | 400 | 200 | <100* | <100 |
| 19 | 1,600 | 1,600 | 800 | <100 |
| 20 | 200 | 200 | 200 | <100 |
| 21 | 100 | 200 | <100* | <100 |
| 22 | 200 | 200 | 200 | <100 |
| 23 | 800 | 400 | 200 | <100 |
| 24 | 1,600 | 1,600 | 1,600 | <100 |
| 25 | 3,200 | 3,200 | 1,600 | <100 |
| 26 | 800 | 800 | 400 | <100 |
| 27 | 800 | 800 | 800 | <100 |
| 28 | 200 | 200 | 200 | <100 |
| 29 | 800 | 800 | 400 | <100 |
| 30 | <100* | 100** | <100* | <100 |
| 31 | <100* | 200** | 200 | <100 |