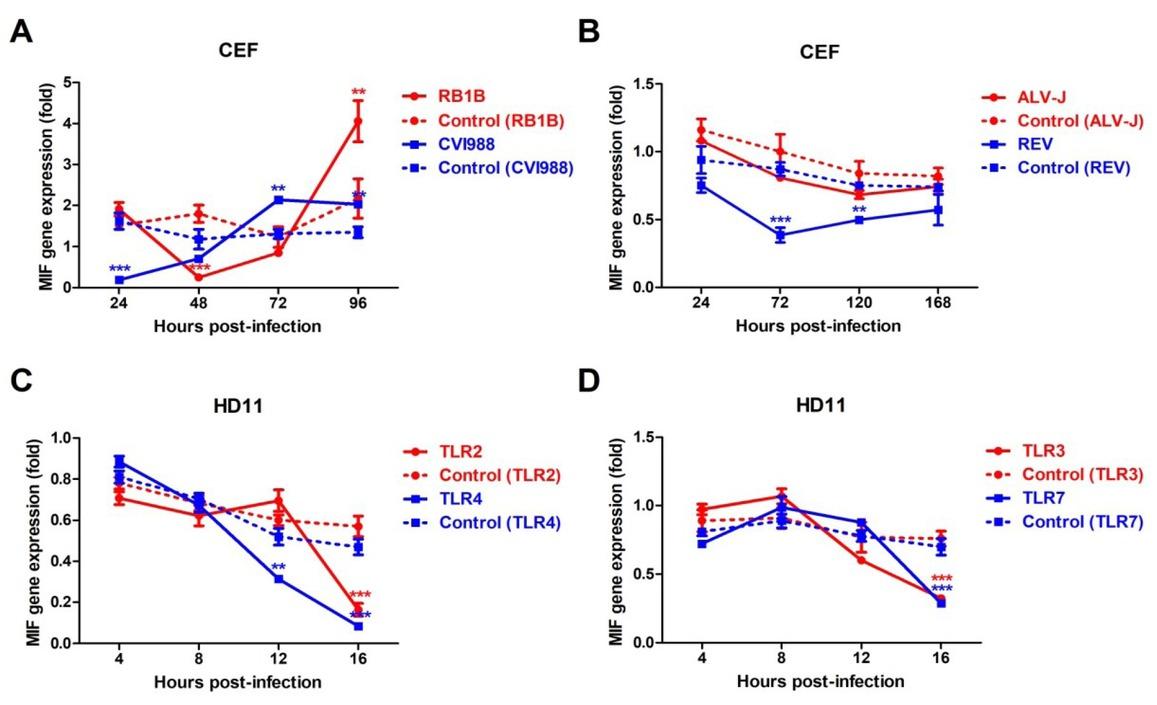
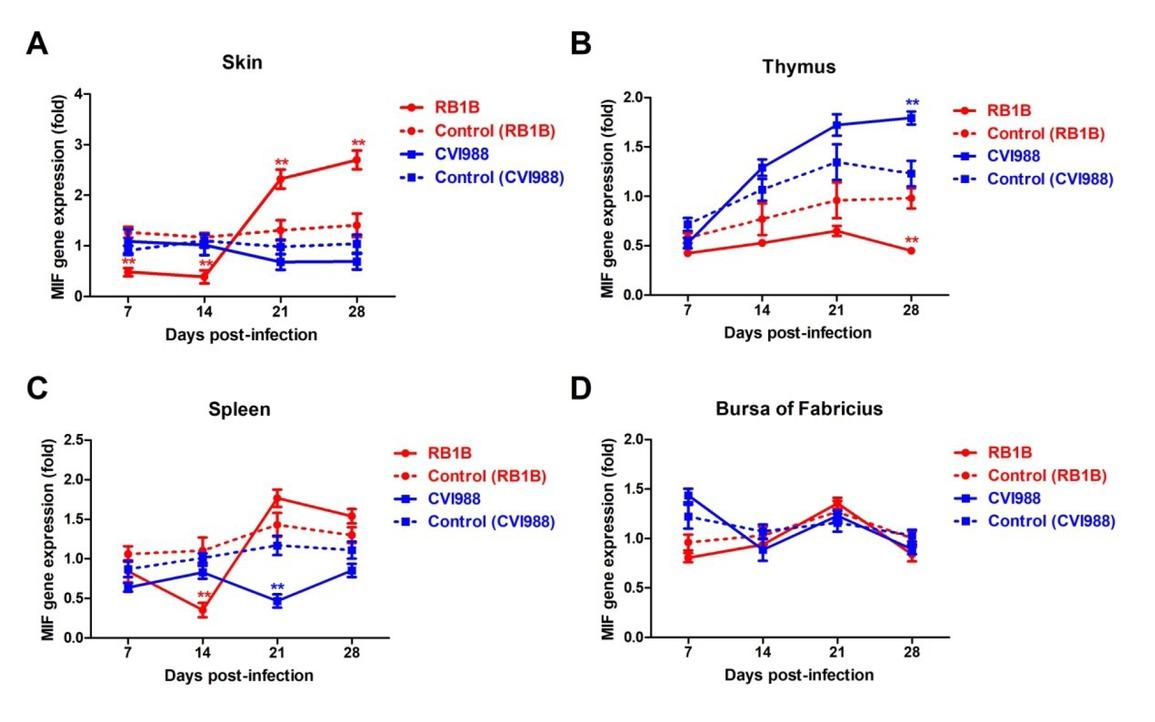
Have a personal or library account? Click to login
Potential role of macrophage migration inhibitory factor in the pathogenesis of Marek’s disease Cover

Potential role of macrophage migration inhibitory factor in the pathogenesis of Marek’s disease

Open Access
|Jan 2020

Figures & Tables

Fig. 1

MIF expression in CEF and HD11 cells. A – expression of MIF in CEF cells infected with RB1B or CVI988 strain; B – expression of MIF in chicken fibroblasts infected with REV or ALV-J; C – expression of MIF in HD11 in response to TLR2 and four stimulations; D – expression of MIF in CEF in response to TLR3 and TLR7 stimulations. The different number of asterisks (*) indicates statistically significant difference for the comparison of control (uninfected or untreated) and infected (or stimulated) transcripts at the same time point as determined by Student’s t-test. ** – P < 0.01, *** – P < 0.001. Error bars represent standard error

Fig. 2

MIF expression in chicken skin infected with RB1B or CVI988 strain. The different number of asterisks (*) indicates statistically significant difference for the comparison of control (uninfected) and infected transcripts at the same time point as determined by Student’s t-test. ** – P < 0.01. Error bars represent standard error

Primers used for real-time PCR

GenePrimer Sequence (5′–3′)Product size (bp)Accession number
MIF

F: GCCCGCGCAGTACATAGC

R: CCCCCGAAGGACATCATCT
57XM42_5824
GAPDH

F: AGGGTGGTGCTAAGCGTGTTA

R: TCTCATGGTTGACACCCATCA
78NM_204305
18S rRNA

F: TCAGATACCGTCGTAGTTCC

R: TTCCGTCAATTCCTTTAAGTT
154AF173612
Language: English
Page range: 33 - 38
Submitted on: Jul 9, 2019
|
Accepted on: Jan 20, 2020
|
Published on: Jan 31, 2020
In partnership with: Paradigm Publishing Services
Publication frequency: 4 issues per year

© 2020 Zhongjun Fan, Huanli Wang, Jiahao Pan, Shupei Yu, Wenlong Xia, published by National Veterinary Research Institute in Pulawy
This work is licensed under the Creative Commons Attribution-NonCommercial-NoDerivatives 3.0 License.