
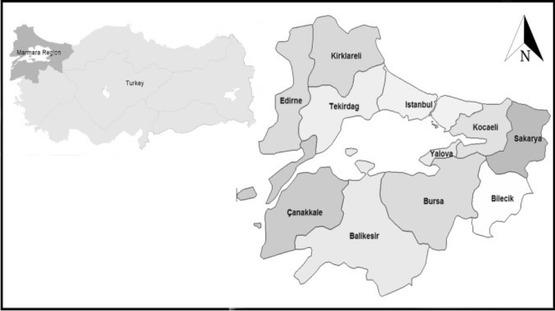
Fig. 1
The age distribution of seropositive animals
| Age (years) | Number of animals (sheep and goats) | Number of seropositive animals (sheep and goats) | Number of animals (sheep) | Number of seropositive animals (sheep) | Number of animals (goats) | Number of seropositive animals (goats) |
|---|---|---|---|---|---|---|
| 1–2 | 195 | 26 | 128 | 18 | 67 | 8 |
| 2–3 | 219 | 24 | 175 | 22 | 44 | 2 |
| 3–4 | 180 | 21 | 137 | 14 | 43 | 7 |
| 4–5 | 137 | 26 | 104 | 22 | 33 | 4 |
| 5–6 | 81 | 9 | 66 | 9 | 15 | - |
| 6–7 | 20 | 4 | 17 | 4 | 3 | - |
The provincial seroprevalence and the proportion of seropositive samples and herds including total values, sheep, and goats
| Provinces | Total seropositivity (sheep + goat) (%) | Seropositive herds (sheep + goat) (%) | Seropositivity of sheep samples (%) | Seropositive sheep herds (%) | Seropositivity of goat samples (%) | Seropositive goat herds (%) |
|---|---|---|---|---|---|---|
| Balikesir | 21.79 | 66.66 | 22.36 | 72.72 | 0.00 | 0.00 |
| Bilecik | 8.23 | 50.00 | 8.33 | 57.15 | 8.00 | 40.00 |
| Bursa | 1.38 | 14.28 | 0.00 | 0.00 | 3.84 | 25.00 |
| Canakkale | 15.71 | 40.00 | 20.51 | 40.00 | 9.67 | 40.00 |
| Edirne | 18.57 | 33.33 | 19.40 | 36.36 | 0.00 | 0.00 |
| Istanbul | 9.41 | 27.27 | 8.00 | 28.57 | 11.42 | 25.00 |
| Kirklareli | 11.59 | 40.00 | 16.66 | 50.00 | 0.00 | 0.00 |
| Kocaeli | 21.42 | 58.33 | 25.00 | 70.00 | 0.00 | 0.00 |
| Sakarya | 10.25 | 33.33 | 5.12 | 25.00 | 15.38 | 50.00 |
| Tekirdag | 11.42 | 50.00 | 8.33 | 44.44 | 30.00 | 33.33 |
| Yalova | 16.47 | 46.15 | 14.63 | 41.66 | 66.66 | 50.00 |
The distribution of the samples regarding the province and animal species
| Provinces | Number of municipalities | Number of villages/ districts | Number of sheep herds | Number of sheep samples | Number of goat herds | Number of goat samples | Total number of samples (sheep and goats) |
|---|---|---|---|---|---|---|---|
| Balikesir | 9 | 12 | 11 | 76 | 1 | 2 | 78 |
| Bilecik | 6 | 12 | 7 | 60 | 5 | 25 | 85 |
| Bursa | 5 | 7 | 3 | 46 | 4 | 26 | 72 |
| Canakkale | 5 | 7 | 5 | 39 | 5 | 31 | 70 |
| Edirne | 8 | 10 | 11 | 67 | 1 | 3 | 70 |
| Istanbul | 6 | 11 | 7 | 50 | 4 | 35 | 85 |
| Kirklareli | 6 | 14 | 12 | 48 | 3 | 21 | 69 |
| Kocaeli | 4 | 10 | 10 | 60 | 2 | 10 | 70 |
| Sakarya | 6 | 11 | 8 | 39 | 4 | 39 | 78 |
| Tekirdag | 5 | 9 | 9 | 60 | 1 | 10 | 70 |
| Yalova | 3 | 7 | 12 | 82 | 1 | 3 | 85 |
The chi-squared results
| Pearson chi-squared test | X2 value | P value |
|---|---|---|
| Age groups and total seropositivity | 6.673 | 0.246 |
| Provinces and total seropositivity | 24.671 | 0.006 |
| Provinces and herd seropositivity | 8.864 | 0.545 |