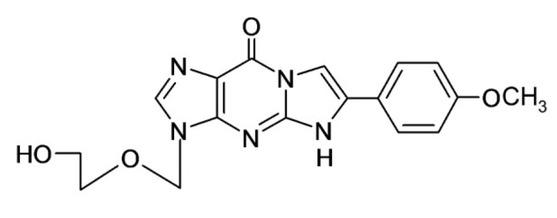
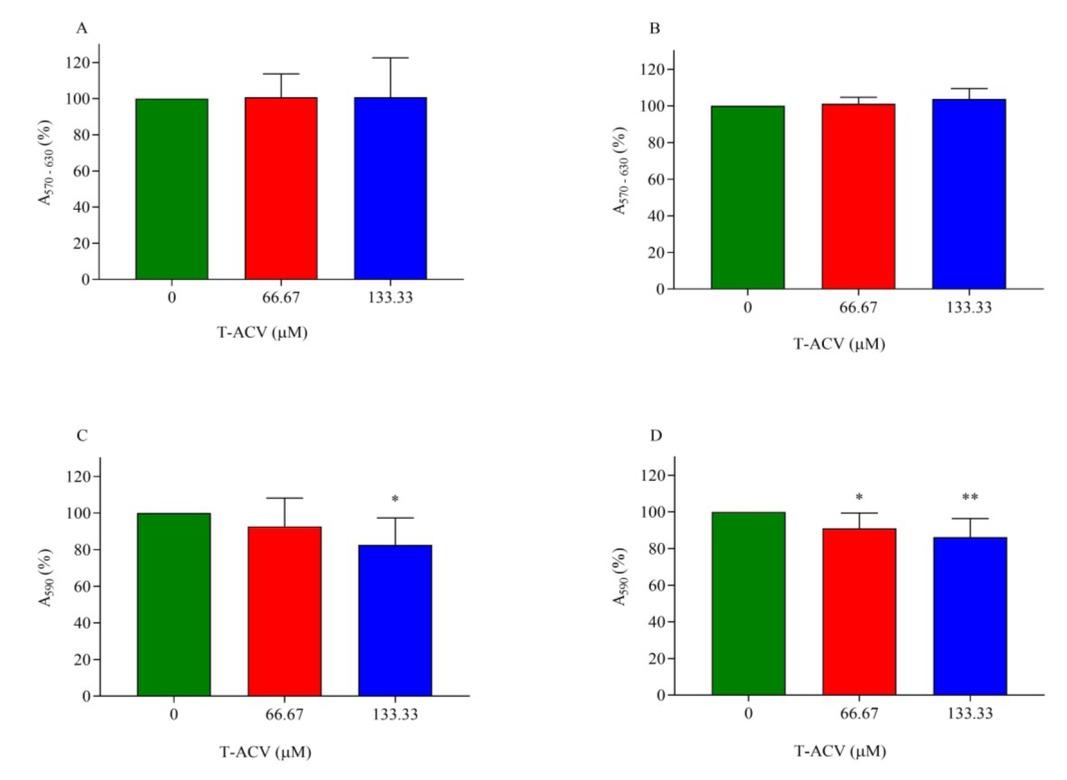
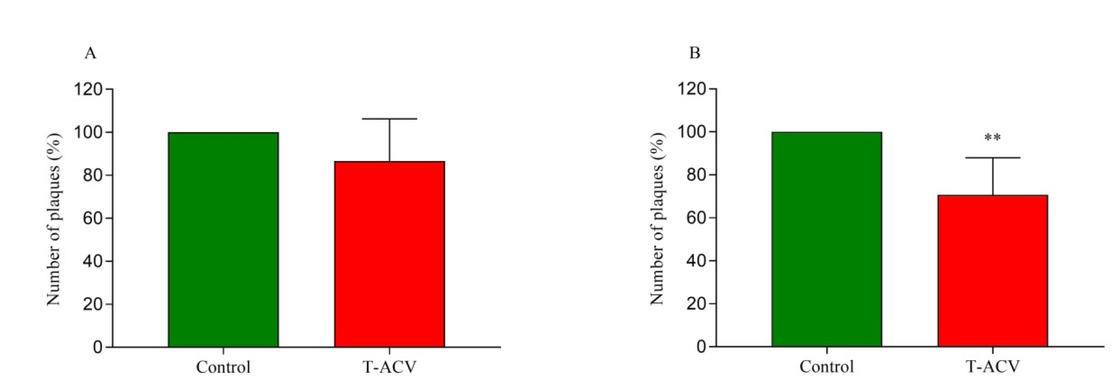
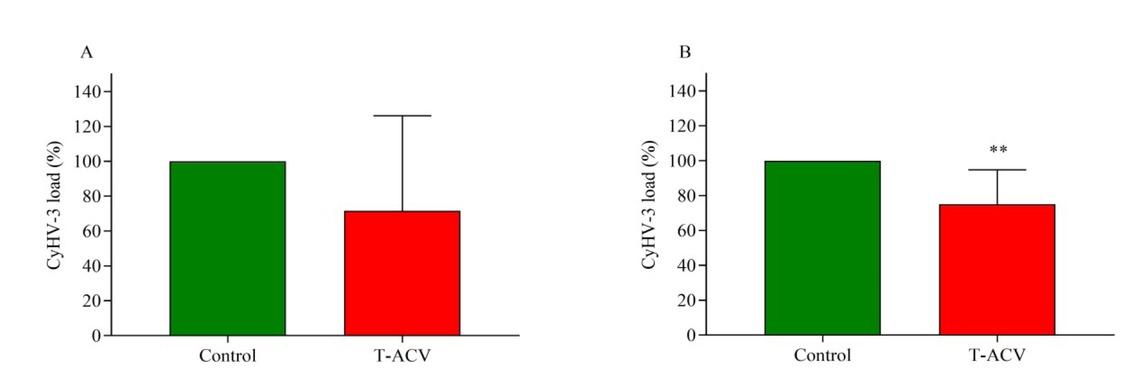
Have a personal or library account? Click to login
Anti-CyHV-3 effect of fluorescent, tricyclic derivative of acyclovir 6-(4-MeOPh)-TACV in vitro Cover

Anti-CyHV-3 effect of fluorescent, tricyclic derivative of acyclovir 6-(4-MeOPh)-TACV in vitro

Open Access
|Oct 2019

Figures & Tables

Fig. 1

The tricyclic derivative of acyclovir 3,9-dihydro-3-((2-hydroxyethoxy)methyl)-6-(4-methoxyphenyl)-9-oxo-5H-imidazo (1,2-a)purine T-ACV

Fig. 2

The cytotoxicity of T-ACV at concentrations of 66.67 and 133.33 μM in CCB and KF1 cell lines at the phase of exponential growth. The graphs depict results yielded by an MTT assay in CCB, n = 9 (A) and KF1, n = 8 (B) and by CV assay in CCB, n =8 (C) and KF1, n = 8 (D). The data are expressed as a percentage of absorbance of the control group (0 μM T-ACV) and presented as mean ± SD. The differences in a paired t-test between the control group and T-ACV group were significant at p ≤ 0.05* or p ≤ 0.01**

Fig. 3

The anti-CyHV-3 activity of T-ACV in CCB, n = 10 (A) and KF1, n = 8 (B) cell lines determined by plaque assay. The data are expressed as a percentage of plaques of the control group (CyHV-3 infected, 0 μM T-ACV) and presented as mean ± SD. The differences in a paired t-test between the control group and T-ACV group were significant at p ≤ 0.01**

Fig. 4

The anti-CyHV-3 activity of T-ACV in CCB, n = 14 (A) and KF1, n = 9 (B) cell lines determined by TaqMan qPCR assay. The data are expressed as a percentage of viral load of the control group (CyHV-3 infected, 0 μM T-ACV) and presented as mean ± SD. The differences in a paired t-test between the control group and T-ACV group were significant at p ≤ 0.01**

Primers and probes used for TaqMan qPCR quantification of CyHV-3 DNA copy number

TargetSequence FPSequence RPProbePrimer sequence source
CyHV-3KHV-86fKHV-163rKHV-109p FAM-
GACGCCGGAGACCTCGGGTTCTTATTTTTCTTCCTCTGCTCGGCGAGCGilad et al. (8)
TGTGGTCCTTGTTACG-BHQ

Carp glucokinaseCgGluc-162fCgGluc-230rcgGluc-185p VIC-
ACTGCGAGTGGAGATCAGGTGTGGAGCGAAGCCAGTGTCAAAATGCGilad et al. (8)
CACATGATGACATTGCCCACT-MGF-NFQ
Language: English
Page range: 513 - 518
Submitted on: Mar 21, 2019
|
Accepted on: Oct 2, 2019
|
Published on: Oct 24, 2019
In partnership with: Paradigm Publishing Services
Publication frequency: 4 issues per year

© 2019 Agnieszka Troszok, Ludmiła Kolek, Joanna Szczygieł, Tomasz Ostrowski, Mikołaj Adamek, Ilgiz Irnazarow, published by National Veterinary Research Institute in Pulawy
This work is licensed under the Creative Commons Attribution-NonCommercial-NoDerivatives 3.0 License.