
Fig. 1
Fig. 2
Fig. 3
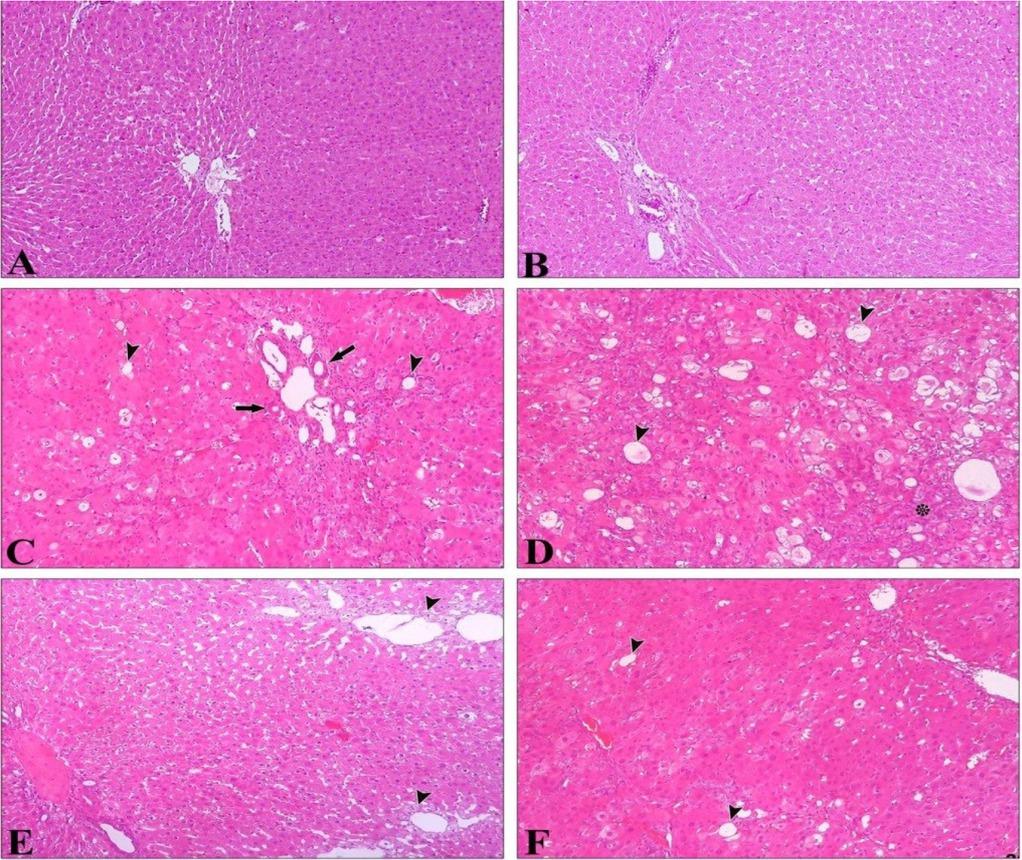
The effect of propolis supplementation on liver histopathological changes
| Control | Propolis | Furan-L | Furan-H | Furan-L+ Propolis | Furan-H+ Propolis | |
|---|---|---|---|---|---|---|
| Oval cell proliferation | 0.0 ± 0.0d | 0.0 ± 0.0d | 1.67 ± 0.33b | 3.00 ± 0.0a | 0.0 ± 0.0d | 1.00 ± 0.0c |
| Pseudo-inclusion | 0.0 ± 0.0d | 0.0 ± 0.0d | 1.00 ± 0.0b | 2.00 ± 0.0a | 0.33 ± 0.21c | 1.00 ± 0.0b |
| Nuclear atypia | 0.0 ± 0.0b | 0.0 ± 0.0b | 1.33 ± 0.21a | 1.50 ± 0.22a | 0.33 ± 0.21b | 1.00 ± 0.0a |
| Karyomegaly | 0.0 ± 0.0c | 0.0 ± 0.0c | 1.17 ± 0.17ab | 1.50 ± 0.22a | 1.00 ± 0.0b | 1.00 ± 0.0b |
| Macrovesicular fatty | 0.0 ± 0.0c | 0.0 ± 0.0c | 1.00 ± 0.37b | 3.00 ± 0.0a | 0.67 ± 0.21b | 1.00 ± 0.0b |
| Apoptotic body | 0.0 ± 0.0d | 0.0 ± 0.0d | 1.33 ± 0.21b | 2.00 ± 0.0a | 1.00 ± 0.0c | 2.00 ± 0.0a |
| Periportal fibrosis | 0.0 ± 0.0c | 0.0 ± 0.0c | 1.33 ± 0.21b | 2.50 ± 0.22a | 1.00 ± 0.0b | 1.00 ± 0.0b |
| Pericentral fibrosis | 0.0 ± 0.0c | 0.0 ± 0.0c | 0.33 ± 0.21bc | 0.50 ± 0.22b | 0.0 ± 0.0c | 1.00 ± 0.0a |
| Capsular fibrosis | 0.0 ± 0.0b | 0.0 ± 0.0b | 0.17 ± 0.17b | 1.00 ± 0.45a | 0.33 ± 0.21ab | 1.00 ± 0.0a |
| Bile duct proliferation | 0.0 ± 0.0d | 0.0 ± 0.0d | 1.67 ± 0.21b | 3.00 ± 0.0a | 1.00 ± 0.0c | 1.00 ± 0.0c |
| Nodule (adenoma) | 0.0 ± 0.0b | 0.0 ± 0.0b | 0.17 ± 0.17ab | 0.50 ± 0.22a | 0.0 ± 0.0b | 0.0 ± 0.0b |
| Sinusoidal congestion | 0.0 ± 0.0d | 0.0 ± 0.0d | 1.50 ± 0.22b | 2.00 ± 0.0a | 1.33 ± 0.21bc | 1.00 ± 0.0c |
| Periportal cell infiltration | 0.0 ± 0.0e | 0.0 ± 0.0e | 1.50 ± 0.22c | 2.50 ± 0.22a | 1.00 ± 0.0d | 2.00 ± 0.0b |
| Single cell necrosis | 0.0 ± 0.0d | 0.0 ± 0.0d | 1.50 ± 0.22b | 2.00 ± 0.0a | 0.67 ± 0.21c | 1.00 ± 0.0c |
| Bile pigment accumulation | 0.0 ± 0.0c | 0.0 ± 0.0c | 1.00 ± 0.37b | 2.00 ± 0.0a | 0.67 ± 0.21b | 1.00 ± 0.0b |
| Sinusoidal congestion | 0.0 ± 0.0c | 0.0 ± 0.0c | 1.00 ± 0.0a | 1.00 ± 0.0a | 0.67 ± 0.21b | 1.00 ± 0.0a |
| Parenchyma degeneration | 0.0 ± 0.0c | 0.0 ± 0.0c | 1.50 ± 0.22b | 2.00 ± 0.0a | 1.33 ± 0.21b | 2.00 ± 0.0a |
| Intestinal metaplasia in the bile duct epithelium | 0.0 ± 0.0b | 0.0 ± 0.0b | 0.0 ± 0.0b | 0.50 ± 0.24a | 0.0 ± 0.0b | 0.0 ± 0.0b |
The effect of propolis supplementation on liver MDA and GSH levels and CAT, GSH-Px, GST, and SOD activities
| Control | Propolis | Furan-L | Furan-H | Furan-L+ Prop. | Furan-H+ Prop. | |
|---|---|---|---|---|---|---|
| MDA (nmol/g tissue) | 0.62 ± 0.02c | 0.59 ± 0.02c | 0.79 ± 0.04b | 0.90 ± 0.05a | 0.67 ± 0.03c | 0.67 ± 0.01c |
| GSH (μmol/ml) | 23.71 ± 0.30a | 23.99 ± 0.21a | 22.48 ± 0.35b | 21.25 ± 0.30c | 23.40 ± 0.24a | 23.39 ± 0.29a |
| CAT (k/mg protein) | 0.260 ± 0.02a | 0.241 ± 0.01a | 0.113 ± 0.02b | 0.042 ± 0.01b | 0.234 ± 0.02a | 0.238 ± 0.01a |
| GSH-Px (U/g protein) | 48.34 ± 2.83a | 47.44 ± 2.09a | 25.79 ± 2.42b | 29.46 ± 0.82b | 42.27 ± 1.16a | 42.39 ± 2.46a |
| GST (U/mg protein) | 23.19 ± 0.84a | 21.05 ± 0.80ab | 14.96 ± 0.84c | 13.87 ± 1.02c | 21.03 ± 0.90ab | 19.97 ± 1.19b |
| SOD (U/g protein) | 77.49 ± 0.25a | 77.19 ± 0.31ab | 74.18 ± 0.22c | 73.00 ± 0.58c | 76.10 ± 0.27ab | 75.83 ± 0.81b |
The effect of propolis supplementation on plasma AST, ALT, ALP, and LDH activities and cholesterol levels
| Control | Propolis | Furan-L | Furan-H | Furan-L+ Prop. | Furan-H+ Prop. | |
|---|---|---|---|---|---|---|
| AST (U/L) | 212.66 ± 22.09bc | 192.0 ± 12.49c | 236.00 ± 10.56bc | 639.00 ± 27.71a** | 192.66 ± 20.52c | 261.00 ± 16.74b |
| ALT (U/L) | 55.66 ± 2.69c | 52.33 ± 3.65c | 62.00 ± 4.70c | 281.0 ± 3.46a** | 42.33 ± 1.72c | 124.50 ± 4.53b |
| ALP (U/L) | 6.66 ± 0.21c | 5.33 ± 0.55c | 7.00 ± 0.80bc | 9.50 ± 0.28a* | 6.00 ± 0.36c | 8.50 ± 0.28ab |
| LDH (U/L) | 969.00 ± 143.21b | 804.50 ± 112.87b | 957.50 ± 32.75b | 1647.33 ± 245.63a** | 768.50 ± 101.32b | 1557.50 ± 115.75a |
| Cholesterol (mg/dL) | 50.66 ± 0.84 | 47.00 ± 2.19 | 56.75 ± 2.89 | 57.00 ± 1.15 | 45.66 ± 1.87 | 47.00 ± 1.15 |