
Fig. 1
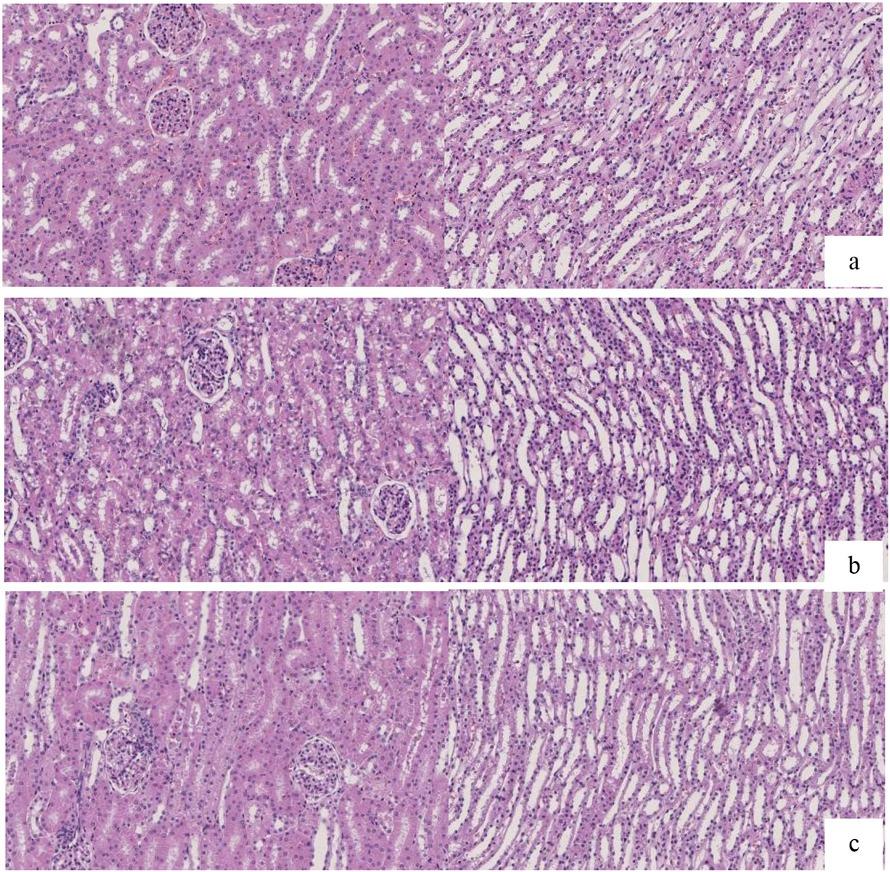
Fig. 2
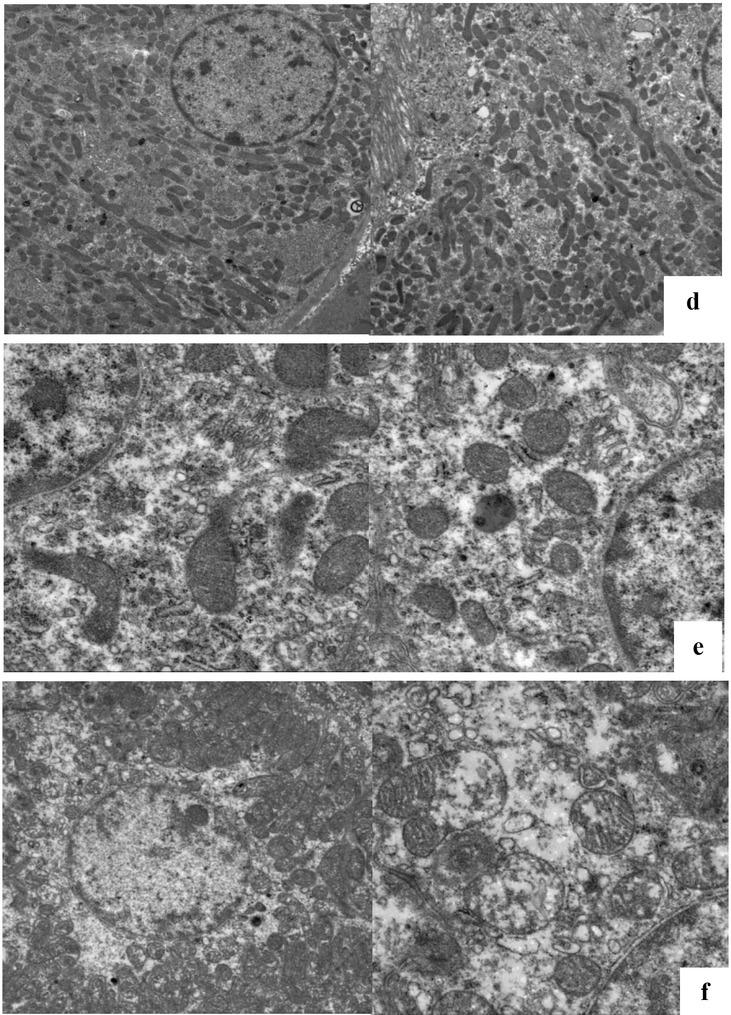
Fig. 3
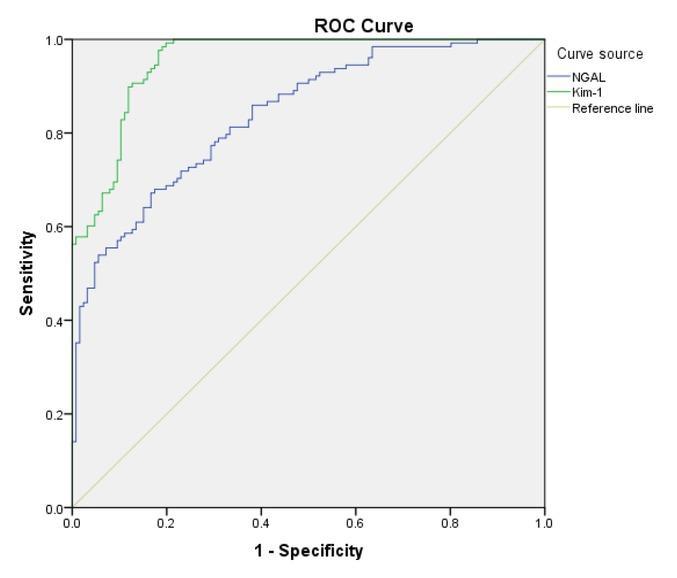
Cutoff concentrations, sensitivity, specificity, and area under the ROC curve of NGAL and Kim-1
| Variables | Area under the curve (AUC) | 95% confidence interval | Standard error |
|---|---|---|---|
| NGAL | 0.84 | 0.793–0.887 | 0.031 |
| Kim-1 | 0.954 | 0.941–0.977 | 0.028 |
Changes in plasma concentrations of renal injury markers before and after gentamicin administration
| Time (h) | NGAL content (ng/mL) | Kim-1 content (pg/mL) | L-FABP content (pg/mL) | SCr content (μmol/L) |
|---|---|---|---|---|
| 0 | 16.42 ± 2.55 | 29.35 ± 2.82 | 161.70 ± 9.77 | 72.50 ± 9.10 |
| 6 | 16.70 ± 2.83 | 27.97 ± 2.15 | 151.85 ± 18.24 | 71.29 ± 6.47 |
| 12 | 18.32 ± 2.27 | 29.51 ± 4.20 | 203.78 ± 43.31* | 71.79 ± 5.96 |
| 18 | 21.81 ± 2.86*** | 33.24 ± 5.60 | 204.86 ± 44.98* | 73.79 ± 5.49 |
| 24 | 24.43 ± 4.02*** | 31.11 ± 6.27 | 197.70 ± 55.87* | 71.07 ± 8.47 |
| 30 | 22.39 ± 3.88*** | 33.44 ± 6.47* | 158.91 ± 38.40 | 75.79 ± 6.17 |
| 36 | 22.11 ± 3.79*** | 39.04 ± 5.86*** | 191.15 ± 51.00 | 73.36 ± 4.03 |
| 42 | 22.13 ± 3.64*** | 51.64 ± 7.99*** | 192.49 ± 52.17 | 74.50 ± 11.80 |
| 50 | 22.89 ± 6.19*** | 57.95 ± 3.32*** | 179.70 ± 18.36 | 78.36 ± 8.08 |
| 56 | 20.85 ± 3.26** | 58.14 ± 4.56*** | 195.61 ± 60.94* | 74.93 ± 7.99 |
| 62 | 23.63 ± 3.17*** | 58.38 ± 5.07*** | 168.15 ± 42.62 | 76.50 ± 6.42 |
| 68 | 22.36 ± 2.37*** | 58.99 ± 6.45*** | 163.16 ± 33.00 | 75.29 ± 6.37 |
| 72 | 25.80 ± 2.69*** | 59.20 ± 6.22*** | 130.70 ± 33.27* | 78.50 ± 5.95 |
| 78 | 30.41 ± 4.60*** | 58.96 ± 5.46*** | 148.56 ± 37.39 | 82.00 ± 4.41* |
| 84 | 32.88 ± 3.63*** | 67.49 ± 8.58*** | 161.701 ± 9.77 | 87.00 ± 4.63* |
| 90 | 33.36 ± 7.26*** | 69.81 ± 8.73*** | 151.85 ± 18.24 | 84.92 ± 8.84* |
| 96 | 33.56 ± 7.80*** | 85.95 ± 9.20*** | 203.78 ± 43.31* | 93.75 ± 8.31*** |
| 102 | 37.89 ± 10.99*** | 90.51 ± 10.84*** | 204.86 ± 44.98* | 115.08 ± 16.75*** |
| 108 | 36.74 ± 3.39*** | 113.89 ± 28.50*** | 197.70 ± 55.87* | 129.00 ± 19.42*** |
Tubular injury score (n = 2)
| Group | Cortical area (score) | Medulla area (score) |
|---|---|---|
| Normal control | 0.20 ± 0.41 | 0.25 ± 0.44 |
| Earliest SCr elevation | 1.50 ± 0.51 | 0.70 ± 0.46 |
| Day of acute kidney injury establishment | 4.95 ± 0.22 | 0.73 ± 0.45 |