
Fig. 1
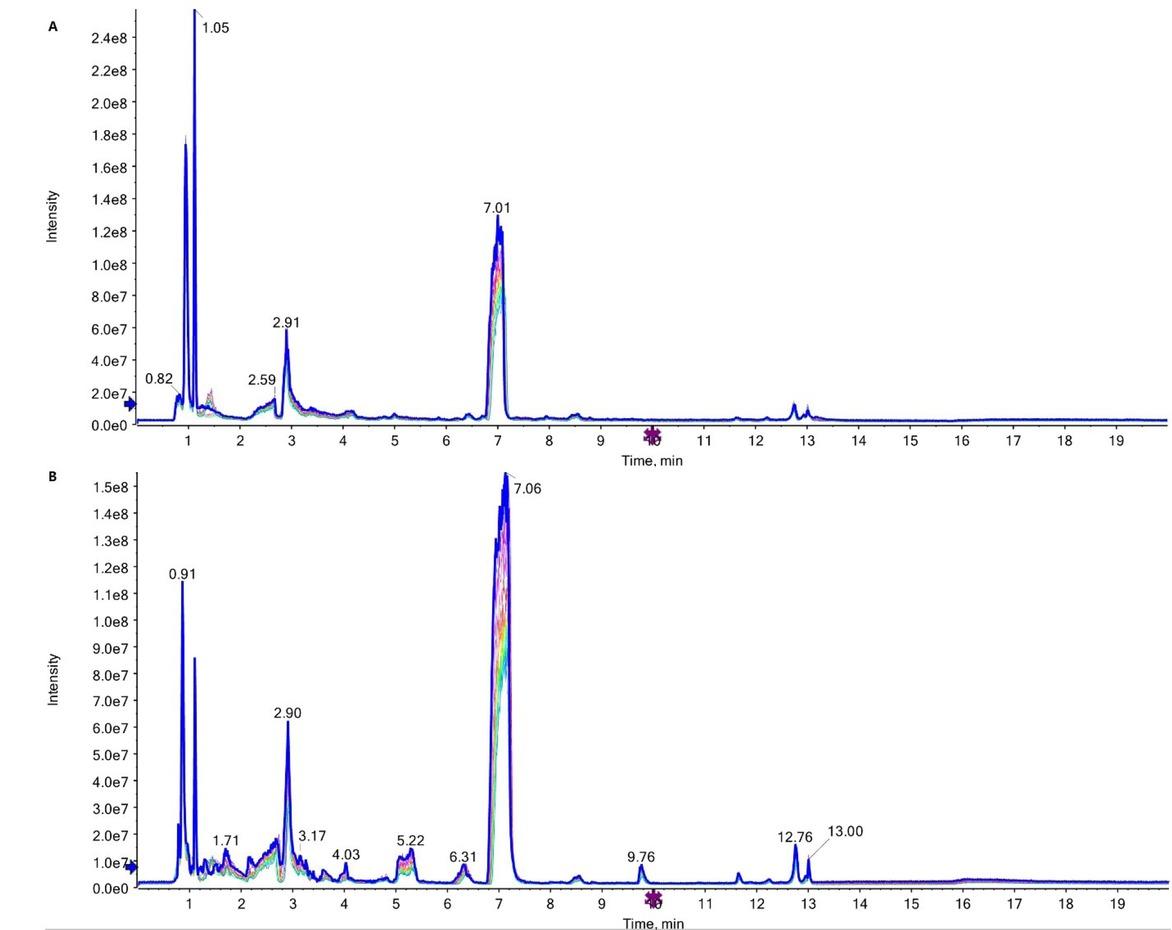
Fig. 2
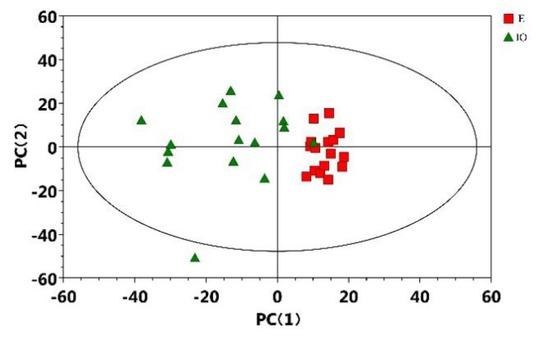
Fig. 3

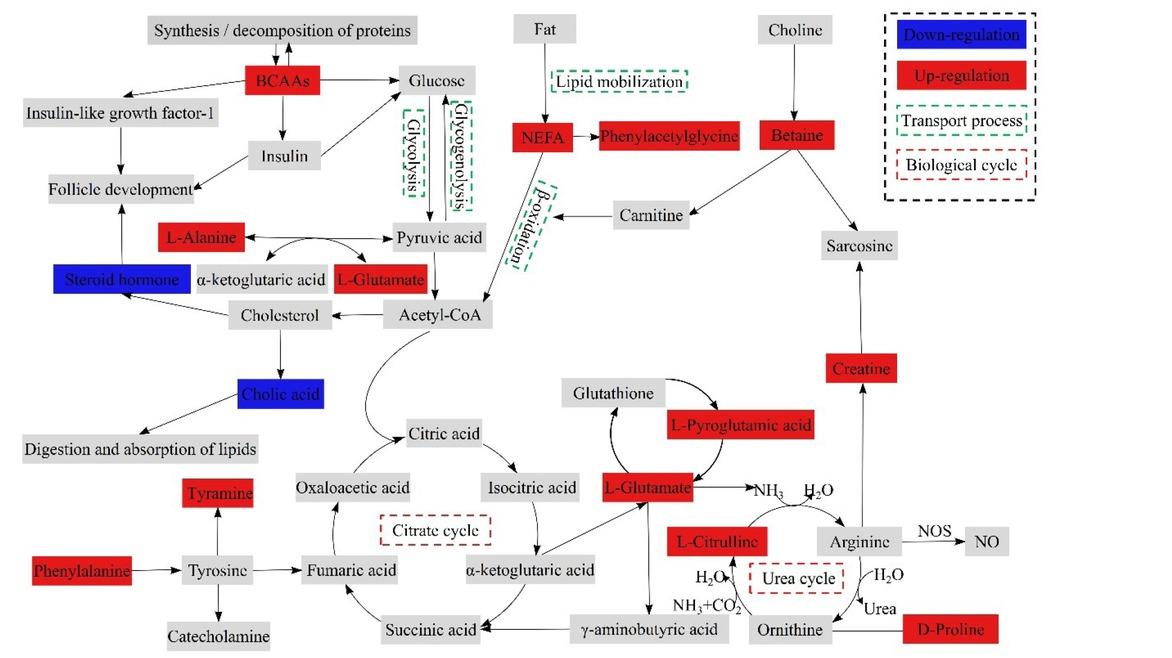
Fig. 4
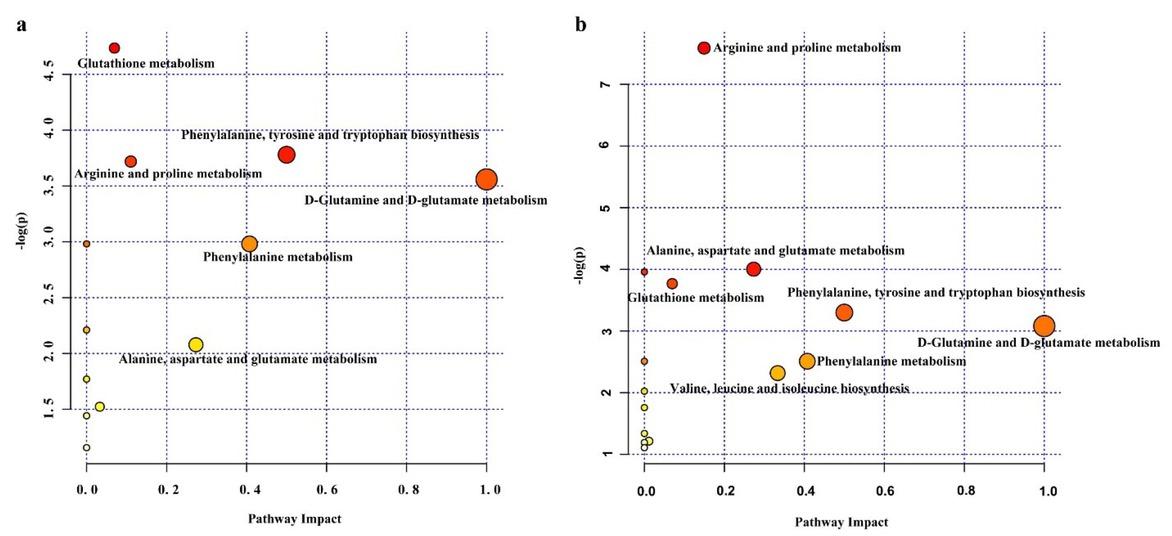
Fig. 5
Clinical data in two groups of cow samples at 50 to 60 d postpartum for LC–MS detection and for ELISA validation
| Parameters | Cow samples for LC–MS detection | Cow samples for ELISA validation | ||
|---|---|---|---|---|
| E | IO | E | IO | |
| No. | 16 | 16 | 16 | 16 |
| Age | 3.58 ± 1.40 | 3.07 ± 1.26 | 3.29 ± 0.34 | 3.23 ± 0.55 |
| Parity | 2.27 ± 1.16 | 1.88 ± 1.09 | 1.91 ± 0.28 | 1.86 ± 0.55 |
| BCS | 2.88 ± 0.29 | 2.69 ± 0.23* | 2.84 ± 0.23 | 2.66 ± 0.21* |
| MY (Kg/d) | 33.56 ± 4.48 | 34.68 ± 5.00 | 33.37 ± 4.48 | 34.90 ± 4.64 |
| Glu (mmol/L) | 3.40 ± 0.34 | 3.36 ± 0.38 | 3.53 ± 0.51 | 3.39 ± 0.39 |
| NEFA (mmol/L) | 0.21 ± 0.05 | 0.32 ± 0.12** | 0.21 ± 0.08 | 0.30 ± 0.13* |
| BHBA (mmol/L) | 0.53 ± 0.21 | 0.63 ± 0.18 | 0.54 ± 0.17 | 0.60 ± 0.28 |
Differential plasma metabolites of IO cows and normal E cows screened by LC–MS
| No. | Metabolites | mzmed | rtmed | VIP value | P value | FC | Mode |
|---|---|---|---|---|---|---|---|
| 1 | Tyramine | 120.0801 | 203.3150 | 1.0774 | 0.0078 | 1.3528 | ESI+ |
| 2 | Betaine | 118.0855 | 288.9015 | 1.3930 | 0.0013 | 1.4872 | ESI+ |
| 3 | L-phenylalanine | 166.0855 | 203.3220 | 1.0598 | 0.0099 | 1.3254 | ESI+ |
| 4 | L-glutamate | 148.0594 | 508.3525 | 1.7459 | 0.0059 | 1.5415 | ESI+ |
| 5 | N6,N6,N6-trimethyl-L-lysine | 189.1587 | 802.7070 | 1.5786 | 0.0003 | 1.4007 | ESI+ |
| 6 | D-proline | 116.0703 | 315.4230 | 1.4542 | 0.0007 | 1.2543 | ESI+ |
| 7 | L-pyroglutamic acid | 130.0490 | 508.3120 | 1.4025 | 0.0050 | 1.2130 | ESI+ |
| 8 | Cholic acid | 391.2832 | 46.9290 | 1.8280 | 0.0003 | 0.6327 | ESI+ |
| 9 | p-chlorophenylalanine | 200.0463 | 243.4400 | 1.2859 | 0.0024 | 0.7587 | ESI+ |
| 10 | L-phenylalanine | 164.0719 | 203.9900 | 1.2468 | 0.0144 | 1.4683 | ESI− |
| 11 | L-citrulline | 349.1815 | 485.9170 | 1.1153 | 0.0177 | 1.6022 | ESI− |
| 12 | L-glutamate | 146.0457 | 510.6010 | 1.8904 | 0.0085 | 1.4992 | ESI− |
| 13 | γ-L-glutamyl-L-valine | 245.1133 | 468.3435 | 1.6628 | 0.0038 | 1.5038 | ESI− |
| 14 | Arachidic acid | 311.2936 | 50.1280 | 1.5495 | 0.0431 | 0.6241 | ESI− |
| 15 | L-leucine | 130.0878 | 219.6660 | 1.4373 | 0.0073 | 1.4759 | ESI− |
| 16 | L-valine | 116.0717 | 290.1260 | 1.5806 | 0.0032 | 1.5261 | ESI− |
| 17 | L-pyroglutamic acid | 128.0356 | 281.0020 | 1.9003 | 0.0025 | 1.6062 | ESI− |
| 18 | L-isoleucine | 130.0877 | 240.2465 | 1.7346 | 0.0010 | 1.6988 | ESI− |
| 19 | L-alanine | 88.0408 | 388.2320 | 1.9019 | 0.0000 | 1.3377 | ESI− |
| 20 | D-proline | 114.0560 | 315.8370 | 1.9989 | 0.0003 | 1.3718 | ESI− |
| 21 | Cytidine | 302.0975 | 208.5070 | 1.1421 | 0.0218 | 1.3280 | ESI− |
| 22 | Creatine | 261.1303 | 388.7810 | 1.5459 | 0.0008 | 1.6097 | ESI− |
| 23 | Phenylacetylglycine | 192.0663 | 103.3500 | 1.7514 | 0.0001 | 1.7482 | ESI− |
| 24 | α-N-phenylacetyl-L-glutamine | 385.1378 | 103.4960 | 1.6689 | 0.0003 | 1.8358 | ESI− |
The ELISA validation of 5 differential metabolites between normal oestrous cows and inactive ovary cows
| Parameters | E | IO |
|---|---|---|
| No. | 16 | 16 |
| Cholic acid, pmol/L | 59.85 ± 11.56 | 52.75 ± 11.88 |
| D-proline, ng/mL | 37.84 ± 5.06 | 41.53 ± 5.14* |
| L-alanine, ng/mL | 91.44 ± 7.24 | 97.52 ± 7.12* |
| L-glutamate, ng/mL | 22.50 ± 3.60 | 24.07 ± 2.72 |
| L-pyroglutamic acid, ng/mL | 3.23 ± 0.52 | 3.60 ± 0.48* |