
Fig. 1
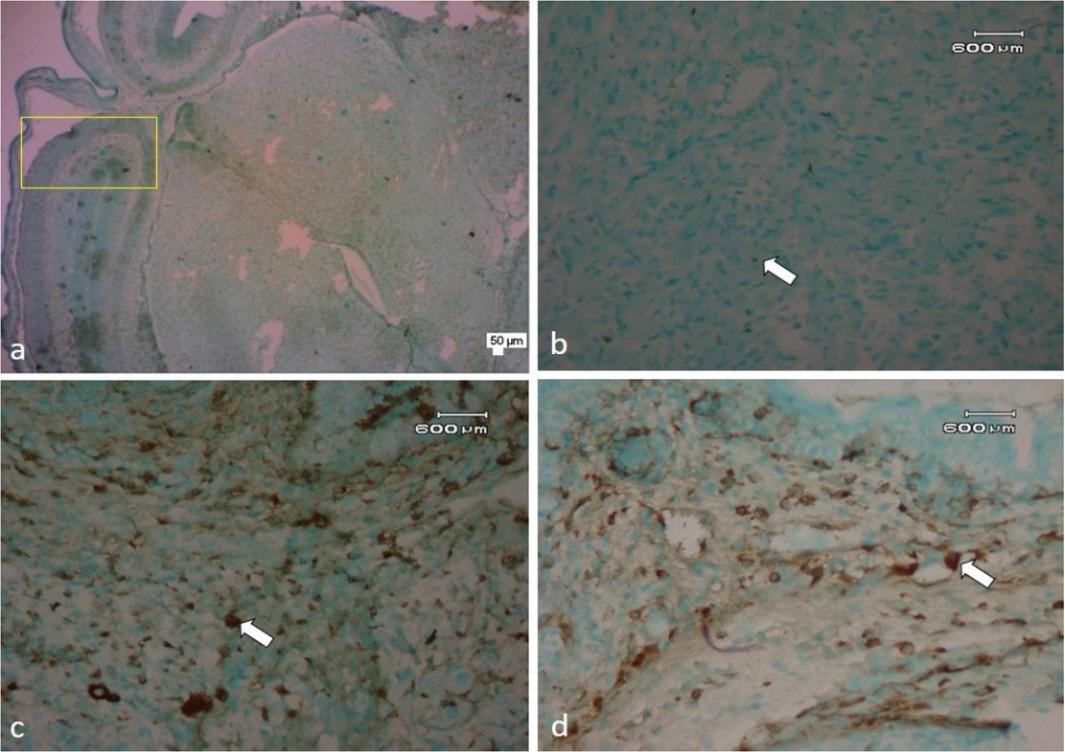
Fig. 2
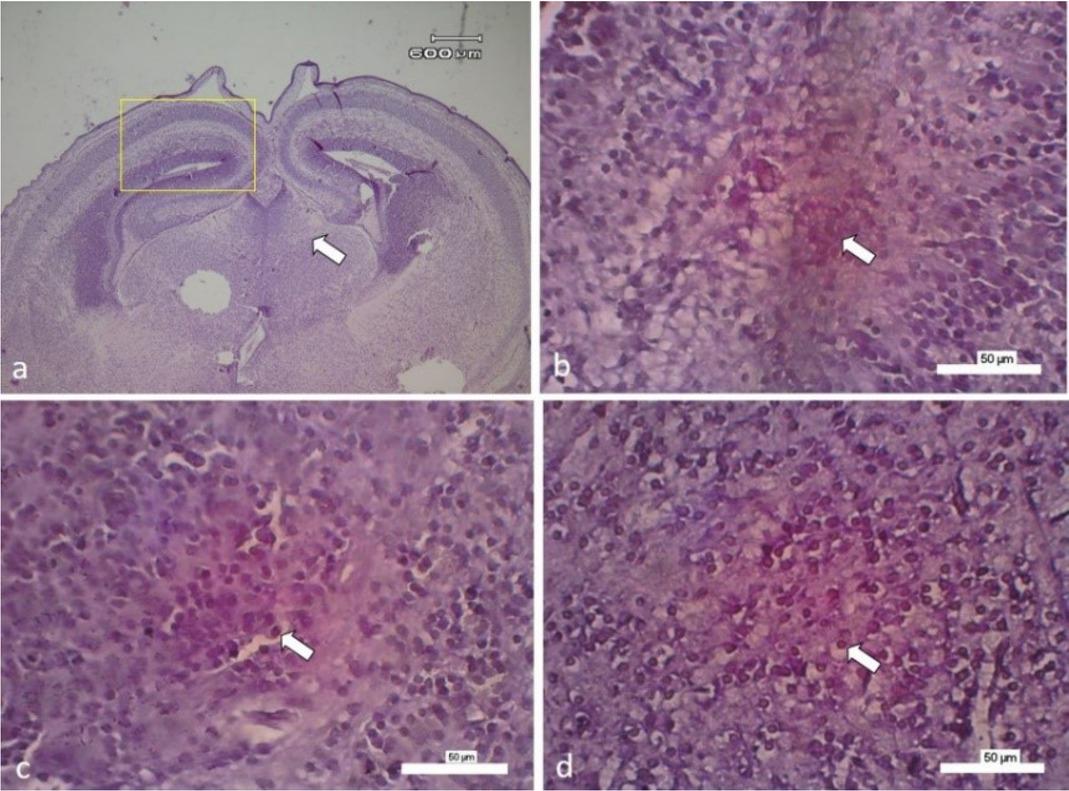
Fig. 3
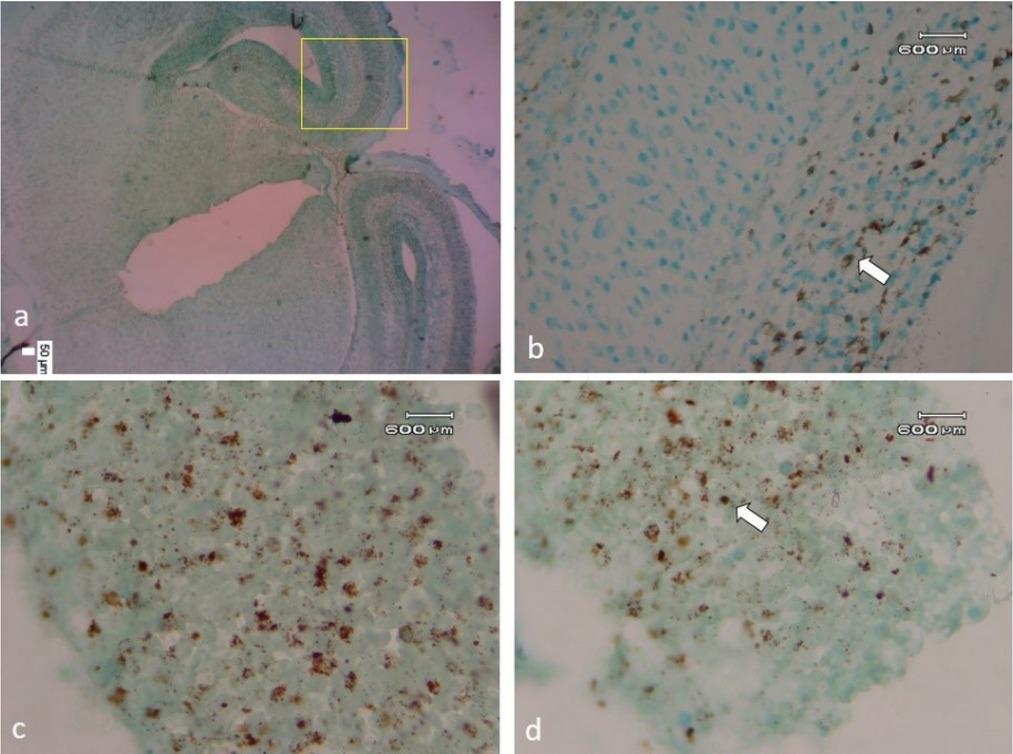
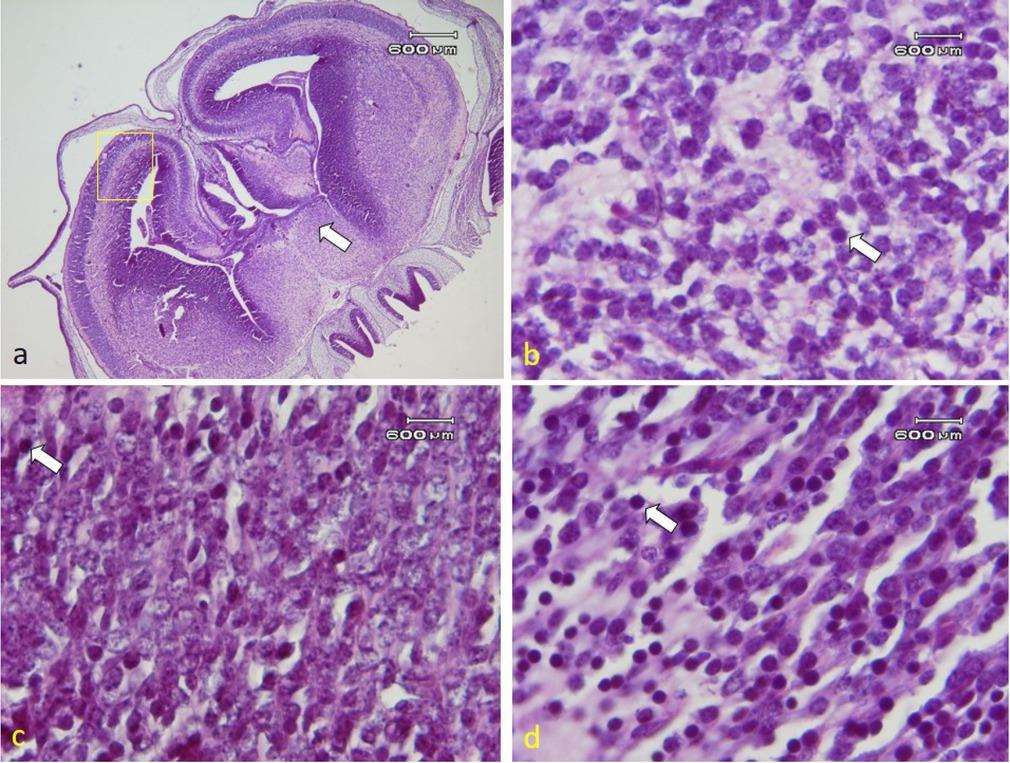
Fig. 4
Results of MDA level, SOD activity, p53 and caspase 3 expression, and number of apoptotic and necrotic neuronal cells
| Parameters | Control | 0.0208 mg/kg b.w. of carbofuran | 0.0417 mg/kg b.w. of carbofuran |
|---|---|---|---|
| Malondialdehyde (nm/mg) | 23.63 ± 10.56 a | 28.26 ± 10.33 ab | 35.76 ± 6.41 b |
| Superoxide dismutase activity (%) | 59.91 ± 18.46 a | 35.77 ± 4.31 b | 34.23 ± 6.91 b |
| p53 expression | 39.04 ± 6.44 a | 54.75 ± 6.67 b | 57.28 ± 9.61 b |
| Caspase 3 expression | 25.44 ± 2.74 a | 40.08 ± 6.68 b | 44.13 ± 7.21 b |
| Neuronal apoptotic cell | 49.13 ± 7.02 a | 64.15 ± 8.08 b | 71.60 ± 7.83 b |
| Neuronal necrotic cell | 5.53 ± 3.03 a | 9.91 ± 4.94 ab | 13.27 ± 7.87 b |