
Fig. 1
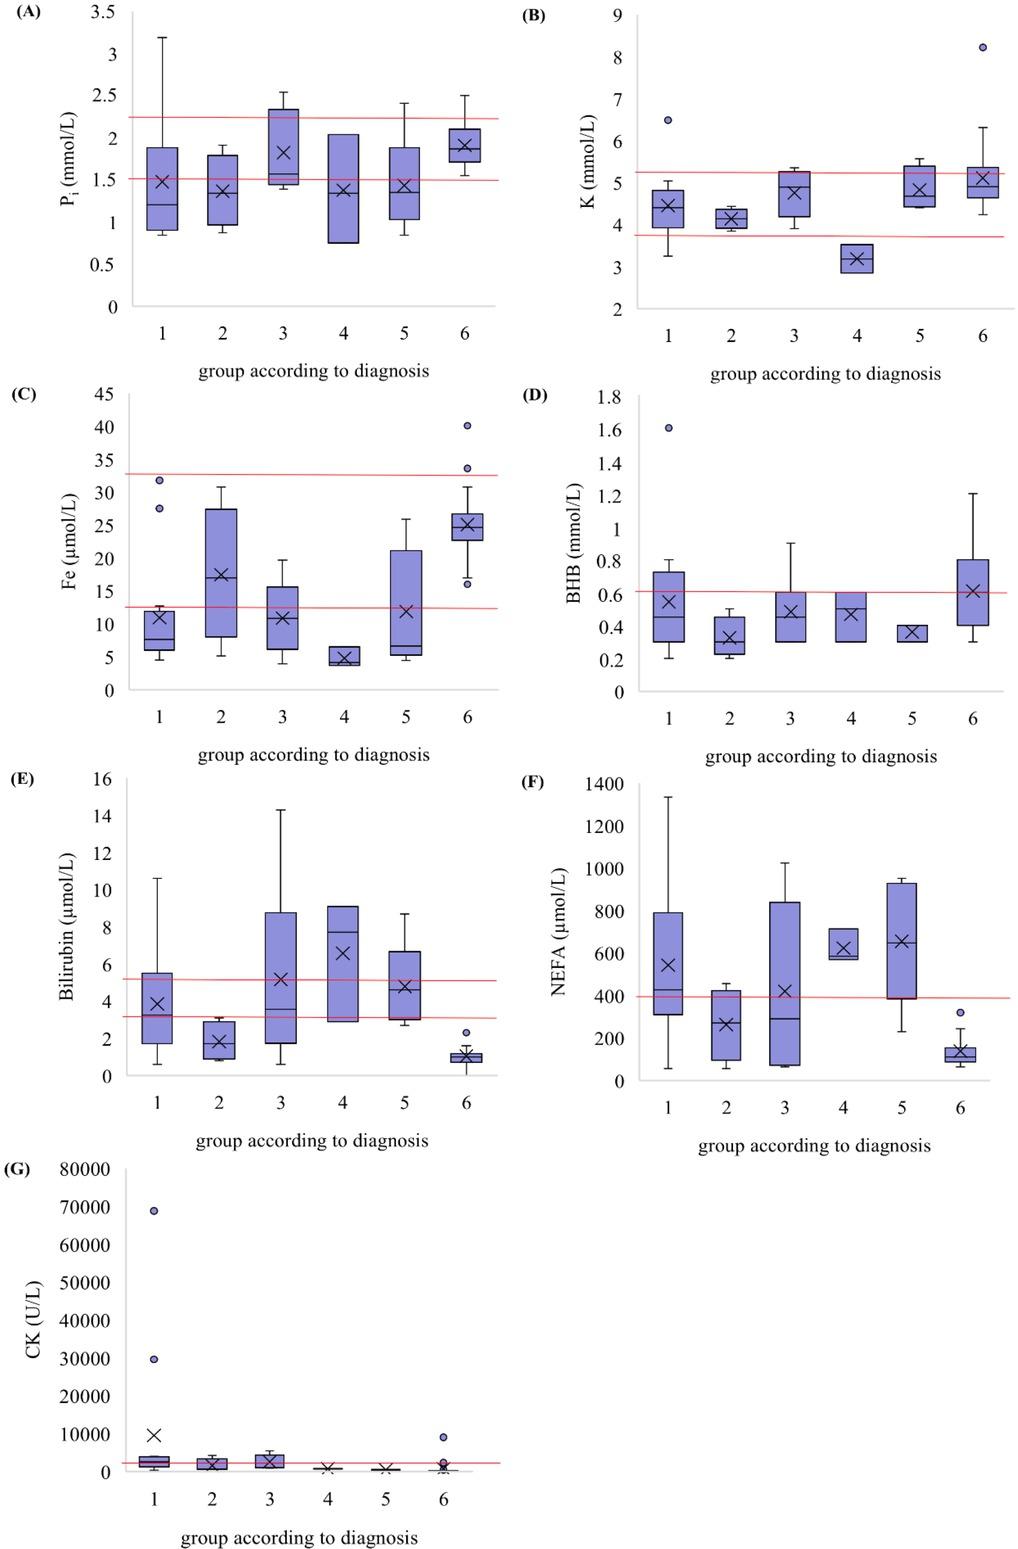
Serum concentrations of examined parameters of the study groups
| RDC group (n = 32) | CDC group (n = 32) | |||
|---|---|---|---|---|
| Parameter | Physiological rangea | Mean ± SD | Mean ± SD | P¥ |
| Mg (mmol/L) | 0.90–1.32 | 0.94 ± 0.16 | 1.03 ± 0.09 | 0.008 |
| Ca (mmol/L) | 2.00–2.54 | 2.32 ± 0.51 | 2.57 ± 0.16 | 0.012 |
| Pi (mmol/L) | 1.55–2.29 | 1.50 ± 0.61 | 1.91 ± 0.24 | < 0.001 |
| Na (mmol/L) | 135.00–157.00 | 147.31 ± 8.21 | 142.59 ± 5.71 | 0.008 |
| K (mmol/L) | 3.90–5.20 | 4.43 ± 0.75 | 5.10 ± 0.77 | < 0.001 |
| Fe (μmol/L) | 13.00–33.00 | 11.31 ± 8.15 | 25.06 ± 4.48 | < 0.001 |
| BHB (mmol/L) | < 0.62 | 0.47 ± 0.27 | 0.61 ± 0.24 | 0.003 |
| Bilirubin (μmol/L) | 3.30–5.30 | 4.24 ± 3.16 | 1.03 ± 0.55 | < 0.001 |
| NEFA (μmol/L) | < 400.00 | 509.72 ± 330.15 | 136.88 ± 76.36 | < 0.001 |
| Urea (mmol/L) | 2.00–6.80 | 5.06 ± 2.07 | 3.91 ± 0.96 | 0.025 |
| Creatinine (μmol/L) | 50.00–150.00 | 70.34 ± 19.67 | 71.05 ± 15.90 | 0.0625 |
| AP (U/L) | 40.00–300.00 | 54.19 ± 24.96 | 45.94 ± 13.98 | 0.062 |
| CK (U/L) | < 150.00 | 5011.28 ± 13386.53 | 666.44 ± 1645.44 | < 0.001 |
| AST (U/L) | < 80.00 | 231.07 ± 207.75 | 92.32 ± 14.96 | 0.020 |
| GGT (U/L) | < 50.00 | 36.43 ± 20.45 | 31.14 ± 12.36 | 0.0625 |
| TP (g/L) | 68.00–82.00 | 84.36 ± 8.01 | 80.72 ± 6.04 | 0.029 |
Descriptive statistics of study groups
| Item | Study groups | ||
|---|---|---|---|
| RDC group (n = 32) | CDC group (n = 32) | ||
| 1 (n/%) | 5 (15.6) | 5 (15.6) | |
| Number of lactations | 2 (n/%) | 7 (21.9) | 7 (21.9) |
| 3 (n/%) | 8 (25.0) | 8 (25.0) | |
| > 3 (n/%) | 12 (37.5) | 12 (37.5) | |
| mean ± SD | 144 ± 110 | 146 ± 111 | |
| DIM | min–max | 7–383 | 6–384 |
| Proportion of gravid cows | (n/%) | 14 (43.8) | 14 (43.8) |
| Day of gestationa | mean ± SD | 95 ± 72 | 89 ± 69 |
Example cross table used for the calculation of odds ratios and McNemar’s test
Detection methods for the serum parameters
| Parameter | Methoda |
|---|---|
| Mg, Ca, Pi | photometric determination |
| Na, K | ion-sensitive electrode |
| Fe | identification with ferrozine (without deproteinisation) |
| BHB | UV method |
| Bilirubin | according to Jendrassik and Grof (10) |
| NEFA, urea | kinetic UV assay |
| Creatinine | Jaffe reaction |
| AST | optimised standard method of DGKC |
| AP, CK | NAC-activated, optimised standard method of DGKC |
| γ-GT | according to Szasz (29) |
| TP | biuret method |
Odds ratios for exceedance or lower deviation of serum parameter threshold values of the experimental group
| RDC group | ||||
|---|---|---|---|---|
| Parameter deviation | Physiological threshold valuea | OR | 95% CI | P¥ |
| Mg ↓ | < 0.90 mmol/L | 3.667 | 1.023–13.143 | 0.092 |
| Ca ↓ | < 2.00 mmol/L | 4.429 | 0.467–42.021 | 0.250 |
| Pi ↓ | < 1.55 mmol/L | x | ||
| Na ↓ | < 135.00 mmol/L | 0.484 | 0.042–5.621 | 1.000 |
| K ↓ | < 3.90 mmol/L | x | ||
| Fe ↓ | < 13.00 μmol/L | x | ||
| BHB ↑ | > 0.62 mmol/L | 0.407 | 0.121–1.369 | 0.227 |
| Bilirubin ↑ | > 5.30 μmol/L | x | ||
| NEFA ↑ | > 400.00 μmol/L | x | ||
| Urea ↑ | > 2.00 mmol/L | x | ||
| Creatinine ↑ | > 150.00 μmol/L | xx | ||
| AP ↓ | < 40.00 U/L | 0.866 | 0.302–2.481 | 1.000 |
| CK ↑ | > 150.00 U/L | 23.059 | 2.778–191.410 | < 0.001 |
| AST ↑ | > 80.00 U/L | 5.357 | 0.555–51.709 | 1.000 |
| GGT ↑ | > 50.00 U/L | 1.554 | 0.241–10.010 | 1.000 |
| TP ↑ | > 82.00 g/L | 2.341 | 0.843–6.353 | 0.210 |