
Table 1
IFABP, LFABP, IAP, TFF3, lactate, SatO2, and WBC levels in healthy calves and calves with atresia coli
| Parameters | Healthy calves (n:10) | Calves with atresia coli (n:40) |
|---|---|---|
| IFABP (ng/mL)*** Median (min/max) | 14.5 (12.4/16.2) | 17.1 (12.4/36.2) |
| LFABP Mean ±SEM (ng/mL)** | 3.18 ± 0.3 | 4.48 ± 0.24 |
| IAP Mean (ng/±SEM mL)*** | 30.0 ± 1.33 | 40.7 ± 2.43 |
| TFFMedian 3 (ng/(min/mL)*** max) | 1.6 (0.9/1.9) | 3.8 (1.5/68) |
| Lactate (mmol/L)*** Mean ±SEM | 1.65 ± 0.09 | 3.88 ± 0.39 |
| SatO2 (%)** Mean ±SEM | 55.5 ± 6.39 | 31.9 ± 2.15 |
| WBC Mean (±10SEM 3/μL)** | 10.4 ± 0.97 | 15.2 ± 1.46 |
[i] IFABP – intestinal fatty acid binding protein, LFABP – liver fatty acid binding protein, TFF3 – trefoil factor 3, IAP – intestinal alkaline phosphatase, WBC – white blood cells, SatO2 – oxygen saturation, SEM – standard error of mean, min/ max – minimum/maximum ** P ≤ 0.01 *** P ≤ 0.001
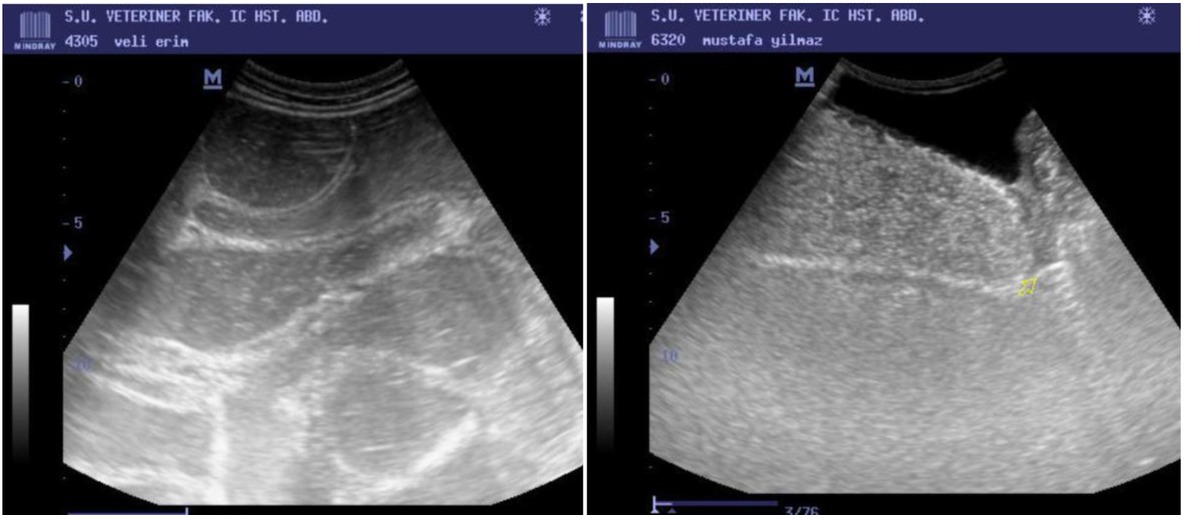
Fig. 1
Enlargement of intestinal loops in calves with atresia coli (the yellow arrow defines the suspected area of atresia in the colon)