
Table 1
Ingredient composition and chemical analysis of the basal diet (g/kg as-fed basis unless stated otherwise)
| Ingredient | Lactating sow | Prestarter | Starter | Grower | Finisher |
|---|---|---|---|---|---|
| (2–8 weeks) | (8–12 weeks) | (12–18 weeks) | (18–24 weeks) | ||
| Oats | 100 | – | – | – | 150 |
| Barley | 250 | 220 | 370 | 125 | 200 |
| Triticale | 110 | – | – | 544 | 361 |
| Wheat | 362 | 300 | 400 | 125 | 150 |
| Soybean meal | 90 | 50 | – | 100 | 110 |
| Soybean oil | 10 | 20 | 20 | 15 | 5 |
| Soybean meal HP + fish meal | 40 | – | – | – | – |
| Post-extraction soybean meal, heat-treated | – | 25 | 140 | – | – |
| Soybeans, full-fat, heat-treated | – | 50 | – | – | – |
| Rapeseed meal | – | – | – | 60 | – |
| Whey permeate | – | 50 | – | – | – |
| Monocalcium phosphate | 2 | – | – | – | – |
| LonoFisha | – | 50 | 25 | – | – |
| Specilacb | – | 40 | – | – | – |
| Lonacid Maxc | – | 5 | 4 | 1 | – |
| LonoGraind | – | 150 | – | – | – |
| Mycofix PLUSe | – | – | 1 | – | – |
| Vitamin-mineral-amino acid premix1 | 36 | – | – | – | – |
| Vitamin-mineral-amino acid premix2 | – | 40 | – | – | – |
| Vitamin-mineral-amino acid premix3 | – | – | 40 | – | – |
| Vitamin-mineral-amino acid premix4 | – | – | – | 30 | 25 |
| Chemical composition | |||||
| Metabolisable energy (MJ/kg) | 13.1 | 13.8 | 13.8 | 13.6 | 13.5 |
| Crude protein (%) | 16.5 | 18.8 | 17.9 | 16.8 | 15.6 |
| Lysine (%) | 0.88 | 1.56 | 1.28 | 1.05 | 0.95 |
| Methionine + Cysteine (%) | 0.59 | 0.82 | 0.76 | 0.66 | 0.57 |
| Threonine (%) | 0.58 | 0.87 | 0.79 | 0.67 | 0.56 |
| Tryptophan (%) | 0.20 | 0.30 | 0.20 | 0.19 | 0.18 |
| Valine (%) | 0.76 | 0.75 | 0.79 | 0.75 | 0.71 |
| Calcium (%) | 1.03 | 0.91 | 0.86 | 0.68 | 0.67 |
| Phosphorus (%) | 0.47 | 0.61 | 0.55 | 0.47 | 0.38 |
| Vitamin A (IU/kg) | 12,500 | 14,000 | 20,500 | 12,000 | 7,700 |
| Vitamin D3 (IU/kg) | 2,000 | 2,000 | 2,000 | 2,000 | 1,540 |
| Vitamin E (mg/kg) | 80 | 84 | 100 | 63 | 100 |
Table 2
Synbiotic and probiotic composition, dosage, and supplementation scheme (sows and offspring)
| Group | Product | Composition | Dose | Period of supplementation (sows) | Period of supplementation (growing pigs) |
|---|---|---|---|---|---|
| Lactobacillus reuteri ŁOCK 1092 | |||||
| Lactobacillus plantarum ŁOCK 0860 | |||||
| A | A | Lactobacillus pentosus ŁOCK 1094 | |||
| Saccharomyces cerevisiae ŁOCK 0118 | |||||
| Inulin | |||||
| Lactobacillus reuteri ŁOCK 1092 | |||||
| Lactobacillus plantarum ŁOCK 0860 | |||||
| Lactobacillus pentosus ŁOCK 1094 | |||||
| B | B | ||||
| Saccharomyces cerevisiae ŁOCK 0118 | |||||
| Lactobacillus rhamnosus ŁOCK 1087 | |||||
| Inulin | |||||
| Lactobacillus reuteri ŁOCK 1092 | |||||
| Lactobacillus plantarum ŁOCK 0860 | 0.5 kg/ton of basal diet | 10 days before farrowing until | from 2 weeks of age until slaughter | ||
| Lactobacillus pentosus ŁOCK 1094 | weaning | ||||
| C | C | Saccharomyces cerevisiae ŁOCK 0118 | |||
| Lactobacillus rhamnosus ŁOCK 1087 | |||||
| Lactobacillus paracasei ŁOCK 1091 | |||||
| Inulin | |||||
| Bacillus subtilis DSM 5750 | |||||
| Bacillus licheniformis DSM 5749 | |||||
| D | BioPlus2B | ||||
| calcium carbonate | |||||
| kieselguhr as anticaking agent | |||||
| Enterococcus faecium NCIMB 10415 | |||||
| E | Cylactin LBC | saccharose as carrier | |||
| cellulose derivative as encapsulating agent | |||||
| K | NA | NA | NA | NA | NA |
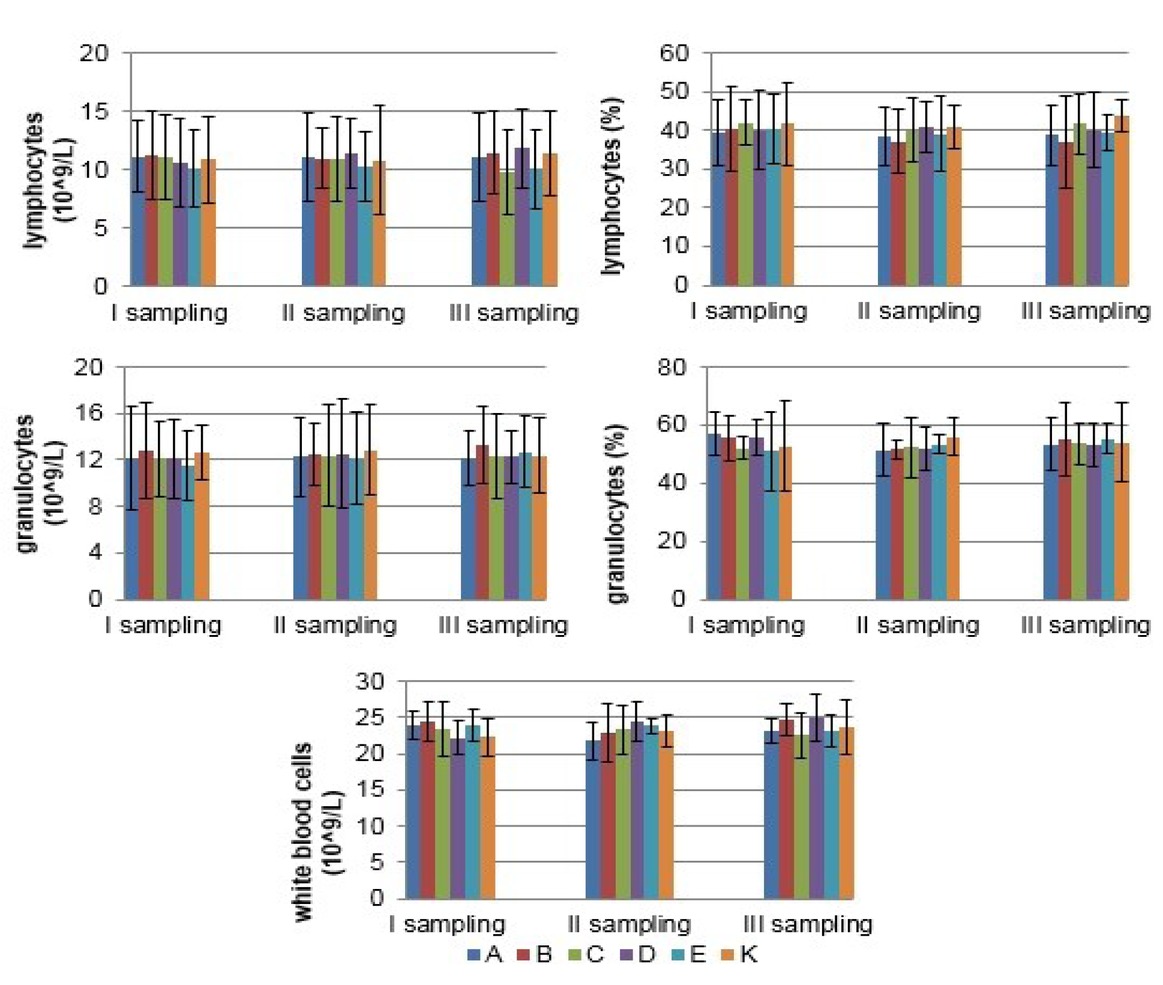
Fig. 1
The mean (±SD) concentration of WBC, LYM, and GRA, and proportion of LYM and GRA in blood of sows in different experimental groups
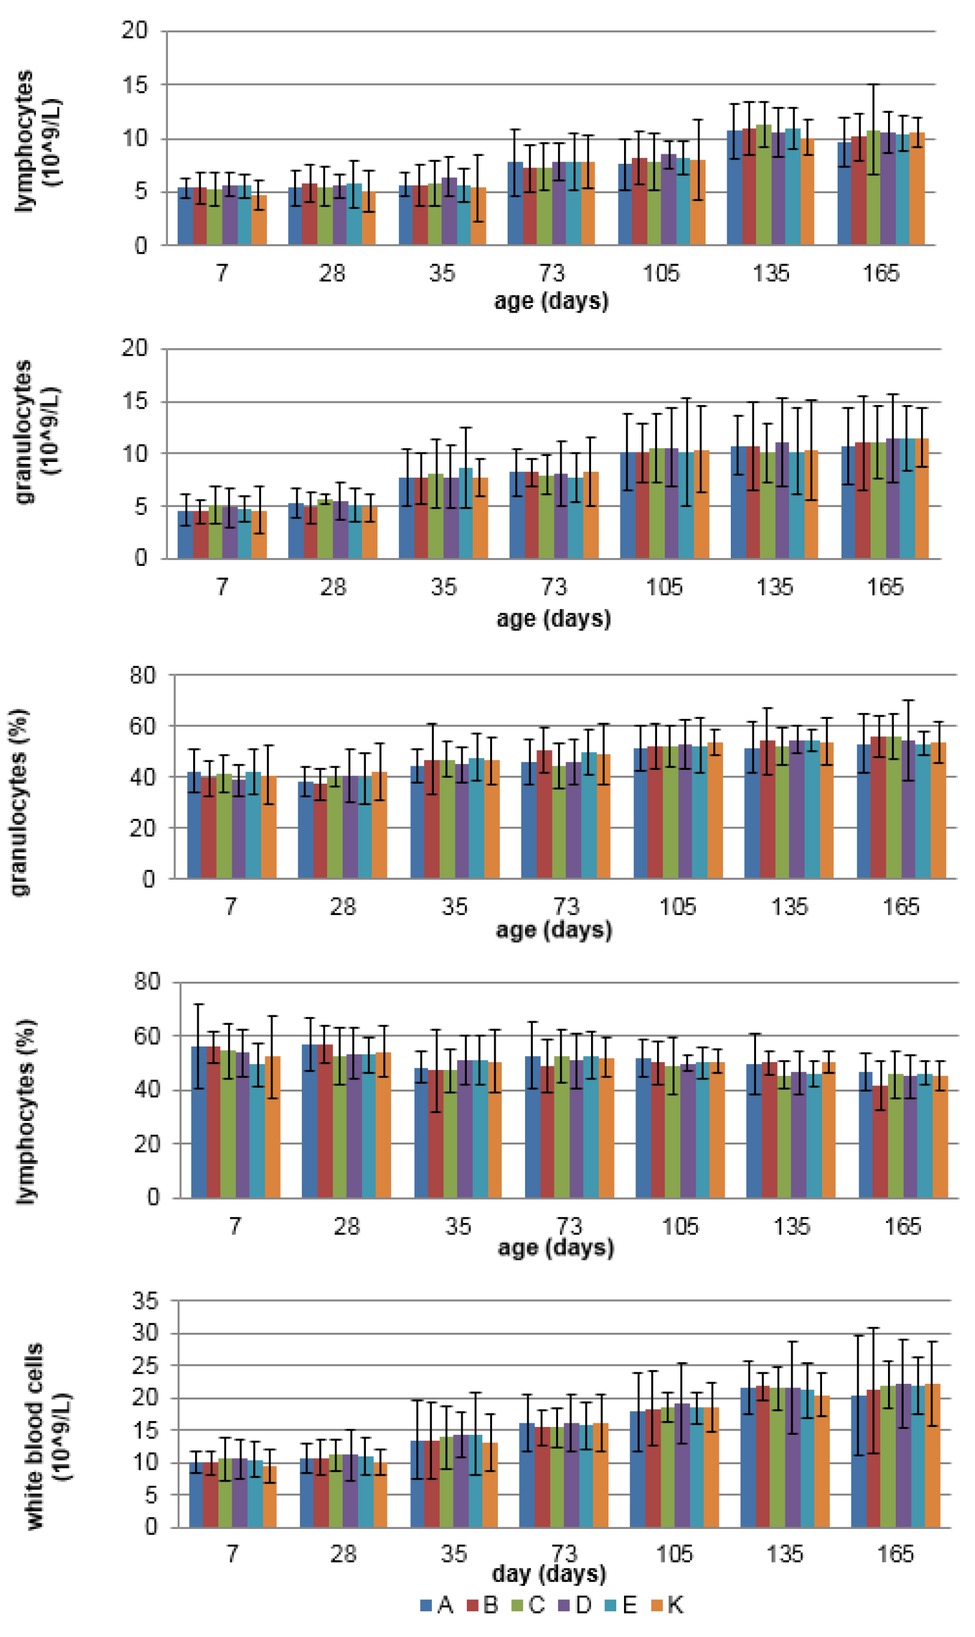
Fig. 2
The mean (±SD) concentration of WBC, LYM, and GRA, and proportion of LYM and GRA in blood of growing pigs in different experimental groups
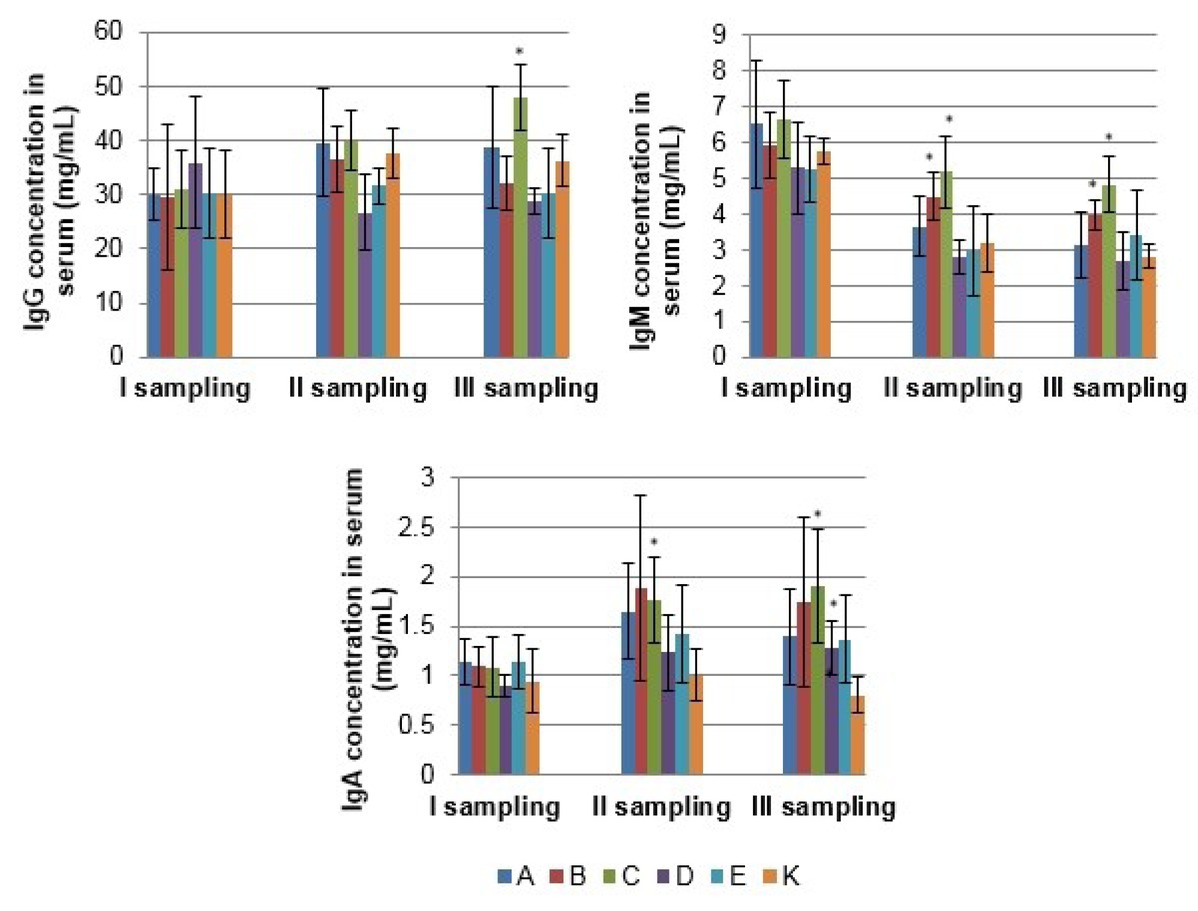
Fig. 3
The mean (±SD) serum IgG, IgM and IgA concentration of sows in different experimental groups; * – statistical difference compared to control group
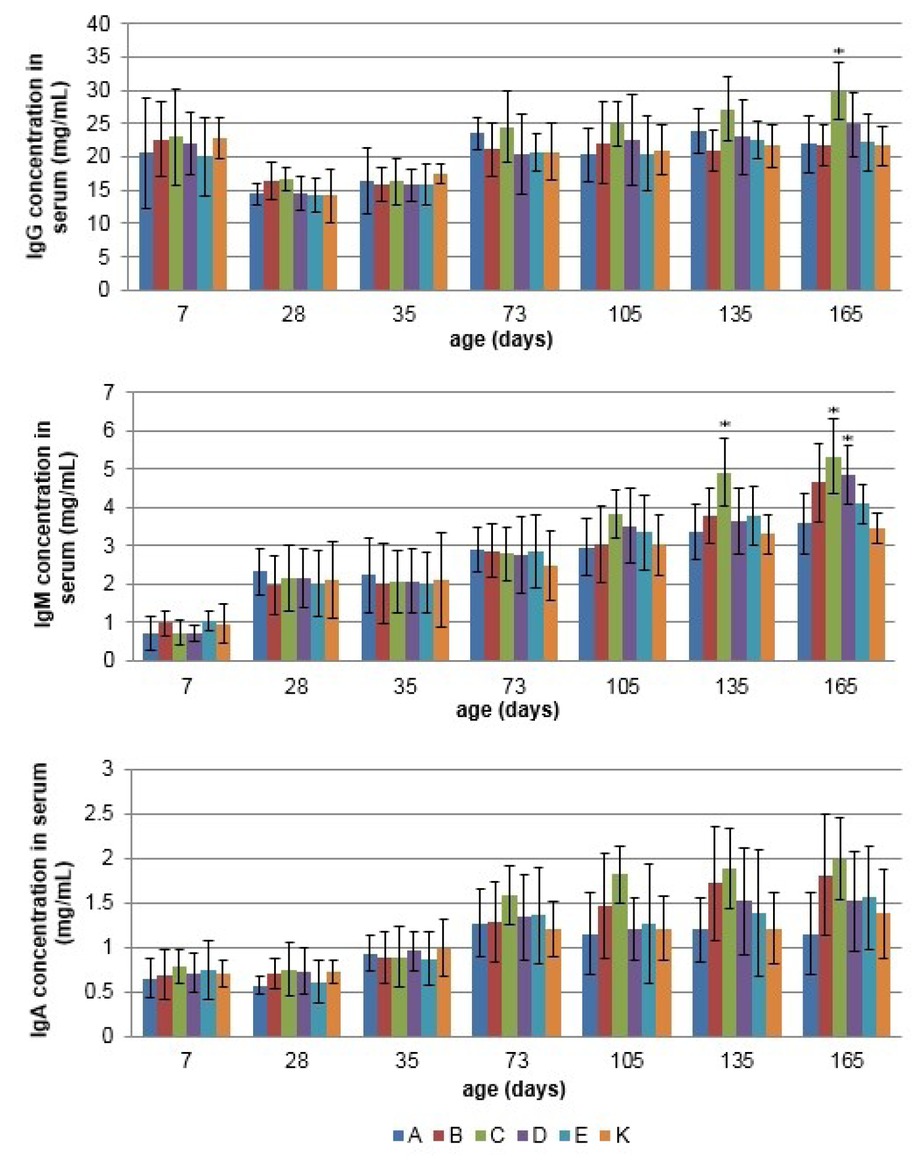
Fig. 4
The mean (±SD) serum IgG, IgM, and IgA concentration of growing pigs in different experimental groups; * – statistical difference compared to control group
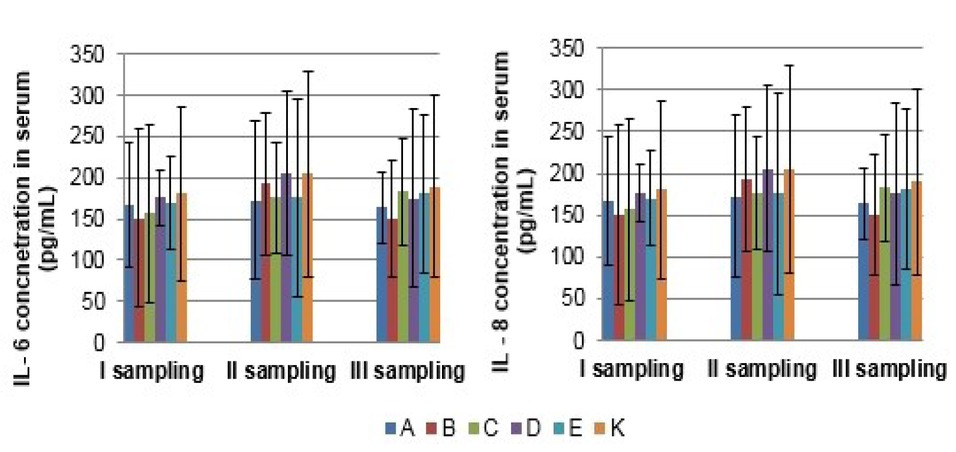
Fig. 5
The mean (±SD) interleukin (IL-6 and IL-8) concentration in serum of sows in different experimental groups
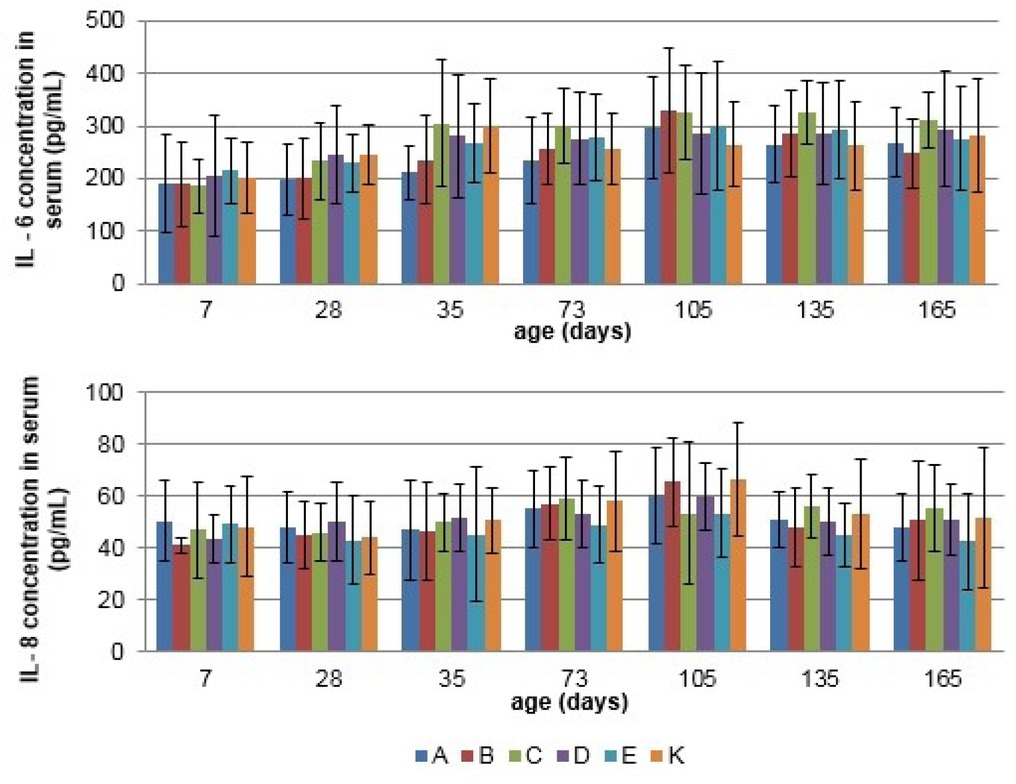
Fig. 6
The mean (±SD) IL-6 and IL-8 concentration in serum of growing pigs in different experimental groups
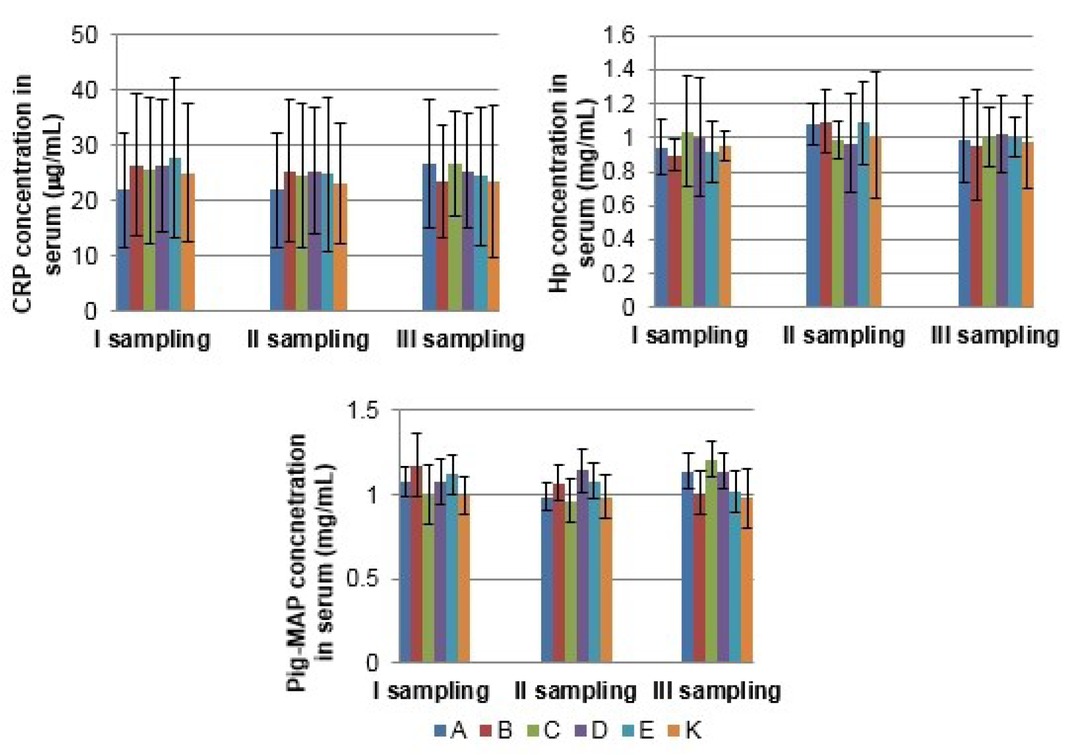
Fig. 7
The mean (±SD) acute phase proteins (CRP, Hp, and Pig-MAP) concentration in serum of sows in different experimental groups
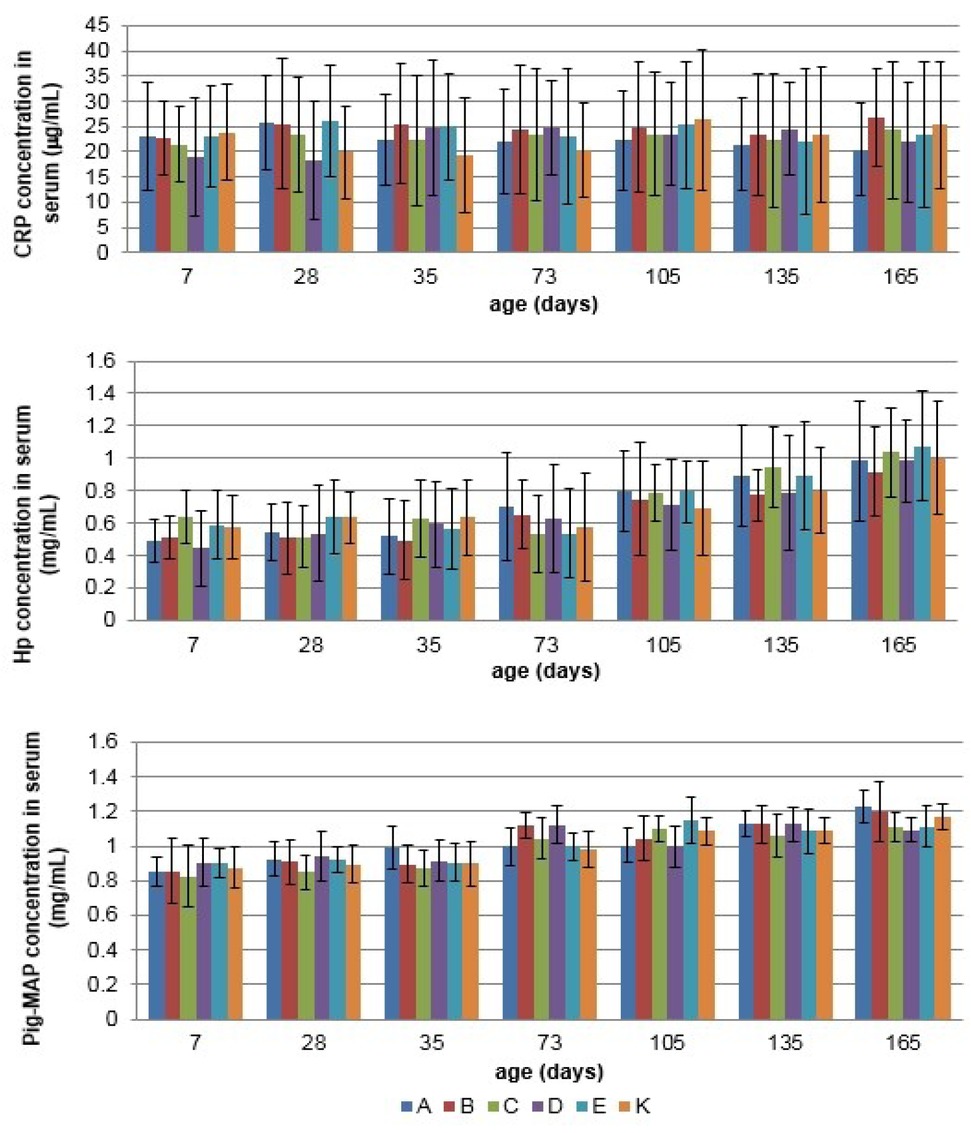
Fig. 8
The mean (±SD) acute phase proteins (CRP, Hp, and Pig-MAP) concentration in serum of growing pigs in different experimental groups