
Table 1
qRT–PCR primers used in this study
| Gene | Primer | Sequence (5'–3') |
|---|---|---|
| TfR1a | F | TCATACCCAGTTTCCCCCAG |
| R | GGTATCCCGAAGCATCCCAT | |
| TfR1b | F | GAGCTGGAAAAATCAGCATGG |
| R | GGAATCCTGGGGTGTAAGGA | |
| Tf | F | CCCTCAGCCAGTGCTCAAAA |
| R | ATAGCATCTGCATCACCAGTC | |
| Fer | F | TGGAGCTGTATGCATCCTACG |
| R | CCCTCCCCTCTGGTTCTGA | |
| 40S | F | CCGTGGGTGACATCGTTACA |
| R | TCAGGACATTGAACCTCACTGTCT |
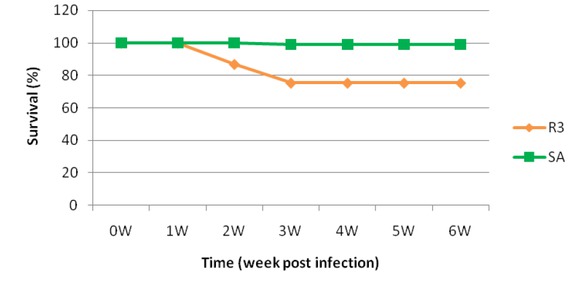
Fig. 1
Common carp strain R3 (♦) and SA strain (■) mortality during Trypanoplasma borreli infection. Carp were infected with 2.6×10⁵ of T. borreli
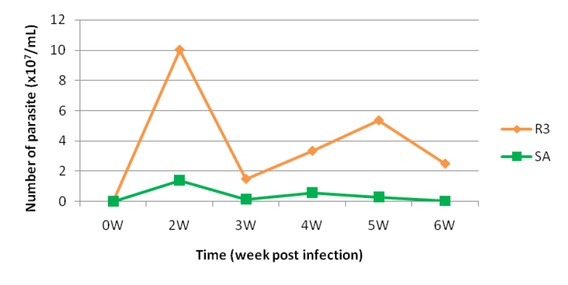
Fig. 2
Parasitaemia of common carp strain R3 (♦) and SA strain (■). Carp were infected with 2.6×10⁵ of T. borreli. The values are means for blood samples from groups of n = 20 fish. Differences between carp strains are significant (P ≤ 0.05) for each time point except 0W
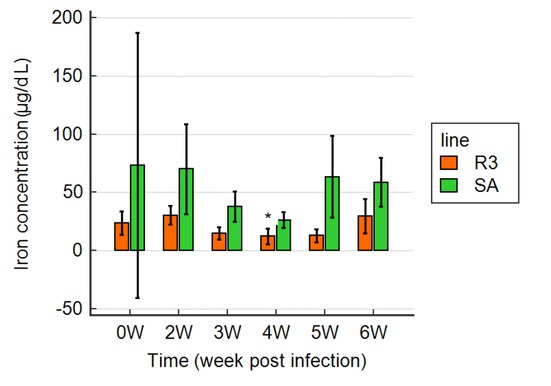
Fig. 3
Serum iron concentration (μg dL-1) in strains R3 (■) and SA (■) during T. borreli infection. The values are means ±SD for blood samples from groups of n = 10 fish. Differences between the control group (not shown) and strains R3 and SA were considered significant for P ≤ 0.05 and marked with an asterisk
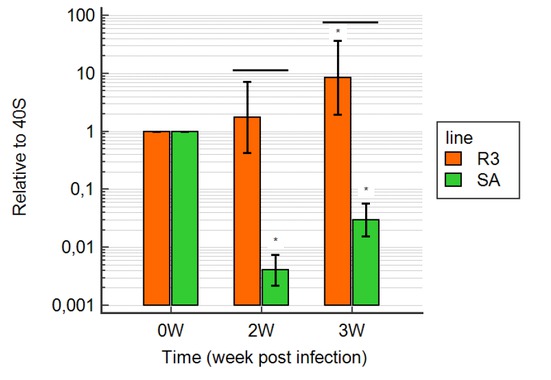
Fig. 4A
Transferrin receptor 1a expression in strain R3 (■) and SA (■) during Trypanoplasma borreli infection. Values after log transformation are expressed as a fold change ±SD relative to 40S (n = 5). Differences between the control group (not shown) and strains R3 and SA were considered significant for P ≤ 0.05 and marked with an asterisk. Differences between the strains were considered significant for P ≤ 0.05 in each time point and marked by a line
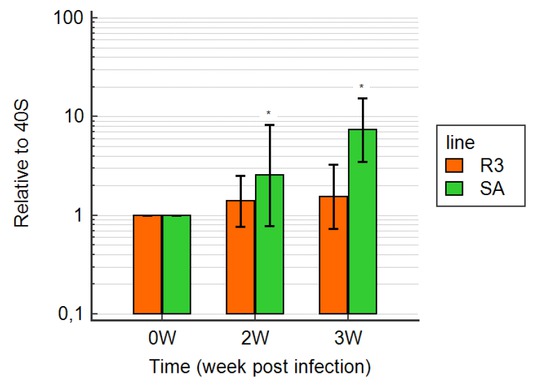
Fig. 4B
Transferrin receptor 1b expression in strain R3 (■) and SA (■) during Trypanoplasma borreli infection. Values after log transformation are expressed as a fold change ±SD relative to 40S ( n = 5). Differences between the control group (not shown) and strains R3 and SA were considered significant for P ≤ 0.05 and marked with an asterisk. Differences between strains were considered significant for P ≤ 0.05 and marked with the asterisks
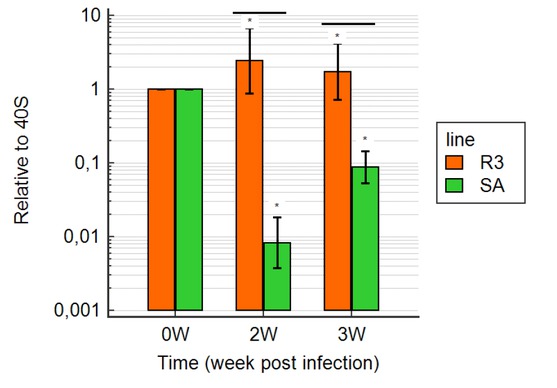
Fig. 4C
Ferritin expression in strain R3 (■) and SA (■) during Trypanoplasma borreli infection. Values after log transformation are expressed as a fold change SD relative to 40S (n = 5). Differences between the control group (not shown) and strains R3 and SA were considered significant for P ≤ 0.05 and marked with an asterisk. Differences between strains were considered significant for P ≤ 0.05 in each time point and marked by a line
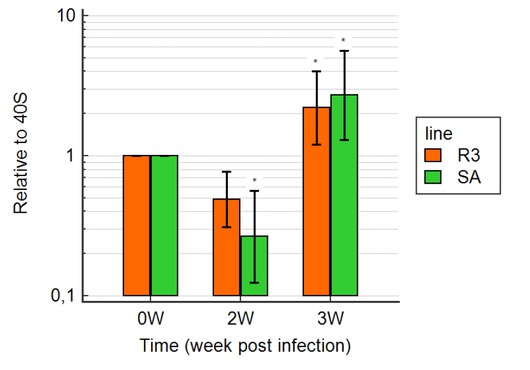
Fig. 4D
Transferrin expression in strain R3 (■) and SA (■) during Trypanoplasmaborreli infection. Values after log transformation are expressed as a fold change ±SD relative to 40S (n = 5). Differences between the control group (not shown) and strains R3 and SA were considered significant for P ≤ 0.05 and marked with an asterisk. Differences between strains were considered significant for P ≤ 0.05 and marked with the asterisks