
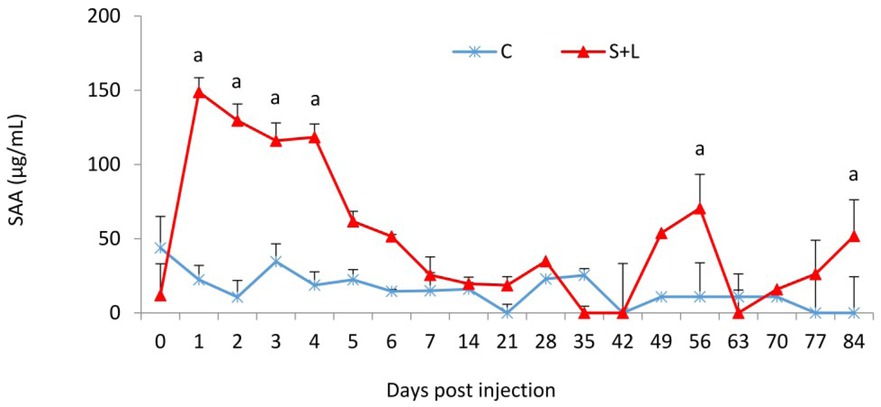
Fig. 1
Serum SAA concentration in the vaccinated (S + L) and control calves (C). The letter a denotes P < 0.05 between groups S + L and C
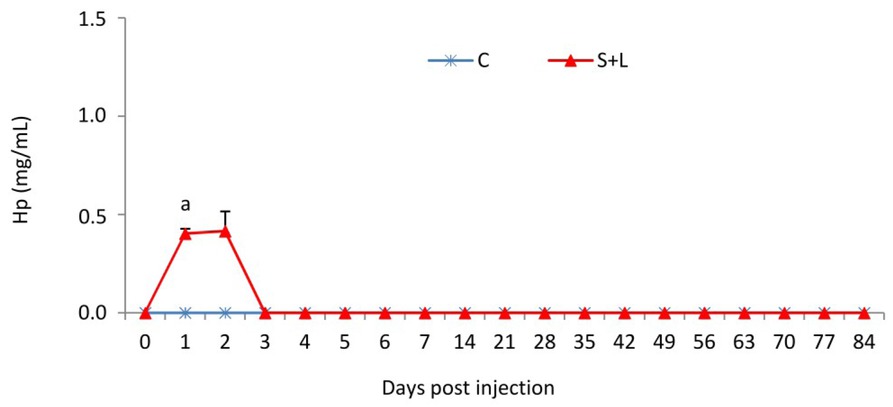
Fig. 2
Serum Hp concentration in the vaccinated (S + L) and control calves (C). The letter a denotes P < 0.05 between groups S + L and C
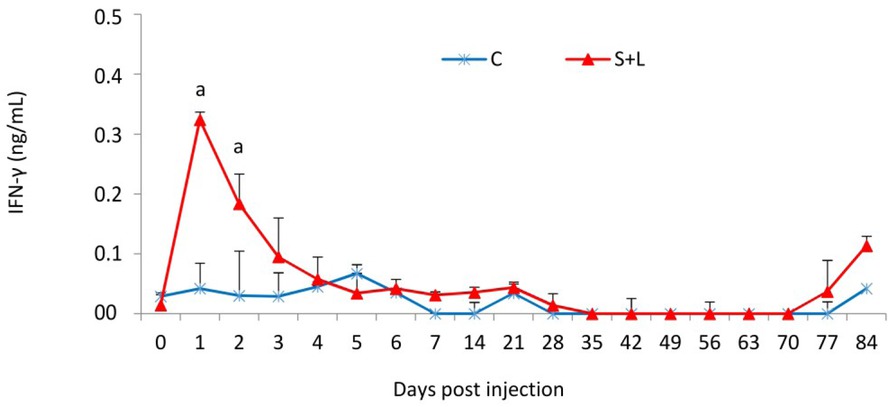
Fig. 3
Serum IFN-γ concentration in the vaccinated (S + L) and control calves (C). The letter a denotes P < 0.05 between groups S + L and C