
Table 1
The average number (mean ±SEM) of leukocytic system cells as count per 1,000 bone marrow cells of all types under physiological conditions (control group) and after simvastatin administration (experimental group)
| Cell type | Day of experiment | Control group | Experimental group |
|---|---|---|---|
| 0 | 0.67 ±0.4A | 0.53 ±1.8A | |
| Myeloblasts | 28 | 0.59 ±0.31A | 5.32 ±1.6B |
| 56 | 0.48 ±0.29A | 4.37 ±1.59B | |
| 0 | 0.66 ±0.23A | 0.64 ±2.8A | |
| Promyelocytes, | 28 | 0.69 ±0.23A | 9.62 ±4.2B |
| 56 | 0.54 ±0.34A | 9.31 ±3.0B | |
| 0 | 2.18 ±0.69A | 2.31 ±5.1A | |
| Neutrophilic myelocytes | 28 | 2.13 ±0.75A | 14.82 ±4.61B |
| 56 | 2.11 ±0.76A | 15.18 ±5.23B | |
| 0 | 7.76 ±3.28A | 8.62 ±8.4A | |
| Neutrophilic metamyelocytes | 28 | 8.41 ±2.36A | 32.54 ±6.21B |
| 56 | 8.28 ±2.27A | 38.68 ±7.38B | |
| 0 | 56.95 ±11.39A | 66.87 ±20.7A | |
| Band neutrophils | 28 | 54.75 ±16.40A | 109.81 ±21.77B |
| 56 | 68.1 ±15.84A | 112.81 ±2.48B | |
| 0 | 156.31 ±48.91A | 143.25 ±40.65A | |
| Neutrophilic granulocytes | 28 | 167.0 ±36.34A | 235.38 ±56.1B |
| 56 | 139.43 ±31.62A | 235.27 ±46.09B | |
| 0 | 0.45 ±0.35A | 0.39 ±1.2A | |
| Eosinophilic myelocytes | 28 | 0.36 ±0.48A | 4.21 ±1.9B |
| 56 | 0.32 ±0.21A | 4.43 ±1.86B | |
| 0 | 0.76 ±0.34A | 0.62 ±1.74A | |
| Eosinophilic metamyelocytes | 28 | 0.85 ±0.86A | 6.24 ±2.34B |
| 56 | 0.53 ±0.28A | 6.56 ±1.90B | |
| 0 | 5.46 ±2.75A | 5.43 ±4.0A | |
| Band eosinophils | 28 | 6.50 ±2.66A | 8.42 ±2.40B |
| 56 | 5.43 ±1.0A | 8.52.4 ±4.03B | |
| 0 | 16.95 ±6.67A | 15.18 ±8.5A | |
| Eosinophilic granulocytes | 28 | 16.25 ±6.59A | 27.18 ±9.6B |
| 56 | 15.74 ±6.66A | 27.18 ±9.57B | |
| Basophilic myelocytes | 0 | 0.51 ±0.09A | 0.51 ±1.6A |
| 28 | 0.45 ±0.1A | 1.65 ±2.3B | |
| 56 | 0.75 ±0.96A | 1.04 ±1.92B | |
| Basophilic metamyelocytes | 0 | 1.4 ±0.23A | 1.57 ±1.5A |
| 28 | 1.56 ±0.24A | 2.68 ±2.8B | |
| 56 | 1.43 ±1.23A | 2.34 ±1.82B | |
| Band basophiles | 0 | 1.96 ±0.34A | 1.62 ±1.6A |
| 28 | 1.24 ±0.31A | 1.68 ±1.5B | |
| 56 | 1.43 ±1.31A | 1.56 ±1.59B | |
| Basophilic granulocytes | 0 | 1.49 ±3.24A | 1.54 ±1.4A |
| 28 | 2.22 ±5.21A | 1.75 ±1.3B | |
| 56 | 1.26 ± 3.69A | 1.75 ±1.29B |
A Statistically significant data (P ≤ 0.05) in particular cell types are marked by different letters in the same row andunsignificant data are marked by the same letters in the same row
A Statistically significant data (P ≤ 0.05) in particular cell types are marked by different letters in the same row andunsignificant data are marked by the same letters in the same row
A Statistically significant data (P ≤ 0.05) in particular cell types are marked by different letters in the same row andunsignificant data are marked by the same letters in the same row
B Statistically significant data (P ≤ 0.05) in particular cell types are marked by different letters in the same row andunsignificant data are marked by the same letters in the same row
A Statistically significant data (P ≤ 0.05) in particular cell types are marked by different letters in the same row andunsignificant data are marked by the same letters in the same row
B Statistically significant data (P ≤ 0.05) in particular cell types are marked by different letters in the same row andunsignificant data are marked by the same letters in the same row
A Statistically significant data (P ≤ 0.05) in particular cell types are marked by different letters in the same row andunsignificant data are marked by the same letters in the same row
A Statistically significant data (P ≤ 0.05) in particular cell types are marked by different letters in the same row andunsignificant data are marked by the same letters in the same row
A Statistically significant data (P ≤ 0.05) in particular cell types are marked by different letters in the same row andunsignificant data are marked by the same letters in the same row
B Statistically significant data (P ≤ 0.05) in particular cell types are marked by different letters in the same row andunsignificant data are marked by the same letters in the same row
A Statistically significant data (P ≤ 0.05) in particular cell types are marked by different letters in the same row andunsignificant data are marked by the same letters in the same row
B Statistically significant data (P ≤ 0.05) in particular cell types are marked by different letters in the same row andunsignificant data are marked by the same letters in the same row
A Statistically significant data (P ≤ 0.05) in particular cell types are marked by different letters in the same row andunsignificant data are marked by the same letters in the same row
A Statistically significant data (P ≤ 0.05) in particular cell types are marked by different letters in the same row andunsignificant data are marked by the same letters in the same row
A Statistically significant data (P ≤ 0.05) in particular cell types are marked by different letters in the same row andunsignificant data are marked by the same letters in the same row
B Statistically significant data (P ≤ 0.05) in particular cell types are marked by different letters in the same row andunsignificant data are marked by the same letters in the same row
A Statistically significant data (P ≤ 0.05) in particular cell types are marked by different letters in the same row andunsignificant data are marked by the same letters in the same row
B Statistically significant data (P ≤ 0.05) in particular cell types are marked by different letters in the same row andunsignificant data are marked by the same letters in the same row
A Statistically significant data (P ≤ 0.05) in particular cell types are marked by different letters in the same row andunsignificant data are marked by the same letters in the same row
A Statistically significant data (P ≤ 0.05) in particular cell types are marked by different letters in the same row andunsignificant data are marked by the same letters in the same row
A Statistically significant data (P ≤ 0.05) in particular cell types are marked by different letters in the same row andunsignificant data are marked by the same letters in the same row
B Statistically significant data (P ≤ 0.05) in particular cell types are marked by different letters in the same row andunsignificant data are marked by the same letters in the same row
A Statistically significant data (P ≤ 0.05) in particular cell types are marked by different letters in the same row andunsignificant data are marked by the same letters in the same row
B Statistically significant data (P ≤ 0.05) in particular cell types are marked by different letters in the same row andunsignificant data are marked by the same letters in the same row
A Statistically significant data (P ≤ 0.05) in particular cell types are marked by different letters in the same row andunsignificant data are marked by the same letters in the same row
A Statistically significant data (P ≤ 0.05) in particular cell types are marked by different letters in the same row andunsignificant data are marked by the same letters in the same row
A Statistically significant data (P ≤ 0.05) in particular cell types are marked by different letters in the same row andunsignificant data are marked by the same letters in the same row
B Statistically significant data (P ≤ 0.05) in particular cell types are marked by different letters in the same row andunsignificant data are marked by the same letters in the same row
A Statistically significant data (P ≤ 0.05) in particular cell types are marked by different letters in the same row andunsignificant data are marked by the same letters in the same row
B Statistically significant data (P ≤ 0.05) in particular cell types are marked by different letters in the same row andunsignificant data are marked by the same letters in the same row
A Statistically significant data (P ≤ 0.05) in particular cell types are marked by different letters in the same row andunsignificant data are marked by the same letters in the same row
A Statistically significant data (P ≤ 0.05) in particular cell types are marked by different letters in the same row andunsignificant data are marked by the same letters in the same row
A Statistically significant data (P ≤ 0.05) in particular cell types are marked by different letters in the same row andunsignificant data are marked by the same letters in the same row
B Statistically significant data (P ≤ 0.05) in particular cell types are marked by different letters in the same row andunsignificant data are marked by the same letters in the same row
A Statistically significant data (P ≤ 0.05) in particular cell types are marked by different letters in the same row andunsignificant data are marked by the same letters in the same row
B Statistically significant data (P ≤ 0.05) in particular cell types are marked by different letters in the same row andunsignificant data are marked by the same letters in the same row
A Statistically significant data (P ≤ 0.05) in particular cell types are marked by different letters in the same row andunsignificant data are marked by the same letters in the same row
A Statistically significant data (P ≤ 0.05) in particular cell types are marked by different letters in the same row andunsignificant data are marked by the same letters in the same row
A Statistically significant data (P ≤ 0.05) in particular cell types are marked by different letters in the same row andunsignificant data are marked by the same letters in the same row
B Statistically significant data (P ≤ 0.05) in particular cell types are marked by different letters in the same row andunsignificant data are marked by the same letters in the same row
A Statistically significant data (P ≤ 0.05) in particular cell types are marked by different letters in the same row andunsignificant data are marked by the same letters in the same row
B Statistically significant data (P ≤ 0.05) in particular cell types are marked by different letters in the same row andunsignificant data are marked by the same letters in the same row
A Statistically significant data (P ≤ 0.05) in particular cell types are marked by different letters in the same row andunsignificant data are marked by the same letters in the same row
A Statistically significant data (P ≤ 0.05) in particular cell types are marked by different letters in the same row andunsignificant data are marked by the same letters in the same row
A Statistically significant data (P ≤ 0.05) in particular cell types are marked by different letters in the same row andunsignificant data are marked by the same letters in the same row
B Statistically significant data (P ≤ 0.05) in particular cell types are marked by different letters in the same row andunsignificant data are marked by the same letters in the same row
A Statistically significant data (P ≤ 0.05) in particular cell types are marked by different letters in the same row andunsignificant data are marked by the same letters in the same row
B Statistically significant data (P ≤ 0.05) in particular cell types are marked by different letters in the same row andunsignificant data are marked by the same letters in the same row
A Statistically significant data (P ≤ 0.05) in particular cell types are marked by different letters in the same row andunsignificant data are marked by the same letters in the same row
A Statistically significant data (P ≤ 0.05) in particular cell types are marked by different letters in the same row andunsignificant data are marked by the same letters in the same row
A Statistically significant data (P ≤ 0.05) in particular cell types are marked by different letters in the same row andunsignificant data are marked by the same letters in the same row
B Statistically significant data (P ≤ 0.05) in particular cell types are marked by different letters in the same row andunsignificant data are marked by the same letters in the same row
A Statistically significant data (P ≤ 0.05) in particular cell types are marked by different letters in the same row andunsignificant data are marked by the same letters in the same row
B Statistically significant data (P ≤ 0.05) in particular cell types are marked by different letters in the same row andunsignificant data are marked by the same letters in the same row
A Statistically significant data (P ≤ 0.05) in particular cell types are marked by different letters in the same row andunsignificant data are marked by the same letters in the same row
A Statistically significant data (P ≤ 0.05) in particular cell types are marked by different letters in the same row andunsignificant data are marked by the same letters in the same row
A Statistically significant data (P ≤ 0.05) in particular cell types are marked by different letters in the same row andunsignificant data are marked by the same letters in the same row
B Statistically significant data (P ≤ 0.05) in particular cell types are marked by different letters in the same row andunsignificant data are marked by the same letters in the same row
A Statistically significant data (P ≤ 0.05) in particular cell types are marked by different letters in the same row andunsignificant data are marked by the same letters in the same row
B Statistically significant data (P ≤ 0.05) in particular cell types are marked by different letters in the same row andunsignificant data are marked by the same letters in the same row
A Statistically significant data (P ≤ 0.05) in particular cell types are marked by different letters in the same row andunsignificant data are marked by the same letters in the same row
A Statistically significant data (P ≤ 0.05) in particular cell types are marked by different letters in the same row andunsignificant data are marked by the same letters in the same row
A Statistically significant data (P ≤ 0.05) in particular cell types are marked by different letters in the same row andunsignificant data are marked by the same letters in the same row
B Statistically significant data (P ≤ 0.05) in particular cell types are marked by different letters in the same row andunsignificant data are marked by the same letters in the same row
A Statistically significant data (P ≤ 0.05) in particular cell types are marked by different letters in the same row andunsignificant data are marked by the same letters in the same row
B Statistically significant data (P ≤ 0.05) in particular cell types are marked by different letters in the same row andunsignificant data are marked by the same letters in the same row
A Statistically significant data (P ≤ 0.05) in particular cell types are marked by different letters in the same row andunsignificant data are marked by the same letters in the same row
A Statistically significant data (P ≤ 0.05) in particular cell types are marked by different letters in the same row andunsignificant data are marked by the same letters in the same row
A Statistically significant data (P ≤ 0.05) in particular cell types are marked by different letters in the same row andunsignificant data are marked by the same letters in the same row
B Statistically significant data (P ≤ 0.05) in particular cell types are marked by different letters in the same row andunsignificant data are marked by the same letters in the same row
A Statistically significant data (P ≤ 0.05) in particular cell types are marked by different letters in the same row andunsignificant data are marked by the same letters in the same row
B Statistically significant data (P ≤ 0.05) in particular cell types are marked by different letters in the same row andunsignificant data are marked by the same letters in the same row
A Statistically significant data (P ≤ 0.05) in particular cell types are marked by different letters in the same row andunsignificant data are marked by the same letters in the same row
A Statistically significant data (P ≤ 0.05) in particular cell types are marked by different letters in the same row andunsignificant data are marked by the same letters in the same row
A Statistically significant data (P ≤ 0.05) in particular cell types are marked by different letters in the same row andunsignificant data are marked by the same letters in the same row
B Statistically significant data (P ≤ 0.05) in particular cell types are marked by different letters in the same row andunsignificant data are marked by the same letters in the same row
A Statistically significant data (P ≤ 0.05) in particular cell types are marked by different letters in the same row andunsignificant data are marked by the same letters in the same row
B Statistically significant data (P ≤ 0.05) in particular cell types are marked by different letters in the same row andunsignificant data are marked by the same letters in the same row
A Statistically significant data (P ≤ 0.05) in particular cell types are marked by different letters in the same row andunsignificant data are marked by the same letters in the same row
A Statistically significant data (P ≤ 0.05) in particular cell types are marked by different letters in the same row andunsignificant data are marked by the same letters in the same row
A Statistically significant data (P ≤ 0.05) in particular cell types are marked by different letters in the same row andunsignificant data are marked by the same letters in the same row
B Statistically significant data (P ≤ 0.05) in particular cell types are marked by different letters in the same row andunsignificant data are marked by the same letters in the same row
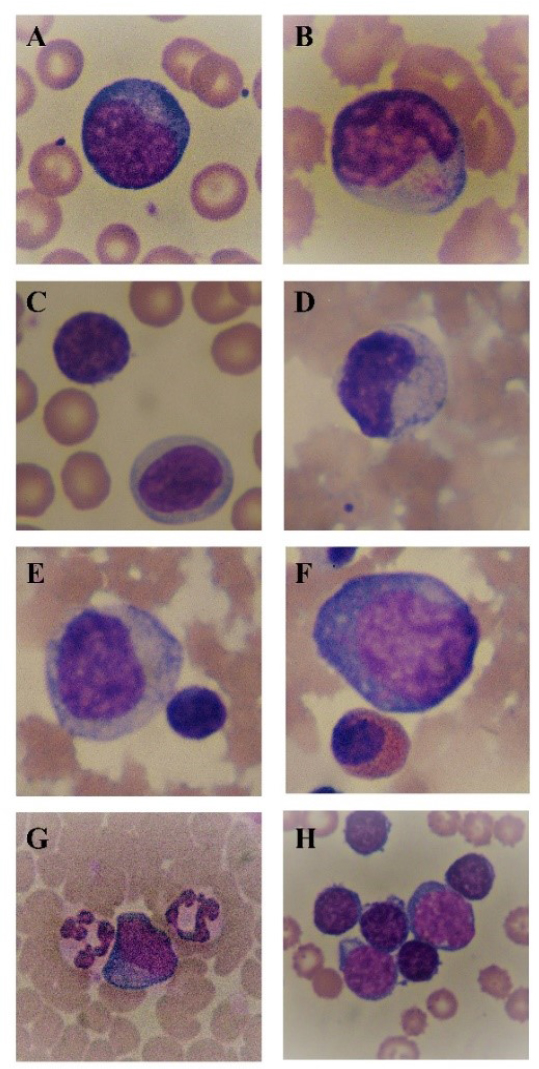
Fig. 1
Myeloid cells in bone marrow smears
A – prolymphocyte, B – eosinophilic myelocyte, C – lymphocytes, D – metamyelocyte, E – promyelocyte and lymphocyte, F – lymphoblast, eosinophilic myelocyte, G – neutrophilic granulocytes and monocyte, H – lymphocytes and prolymphocytes
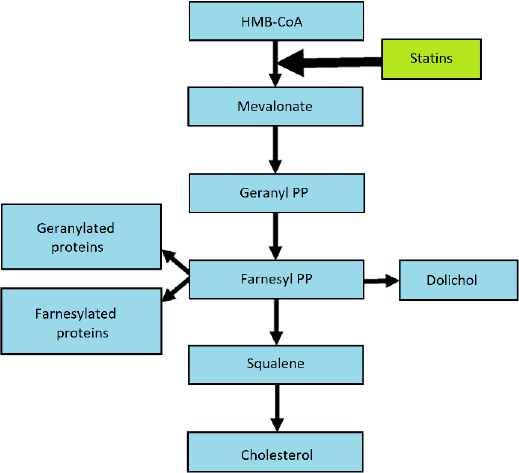
Fig. 2
Mevalonate pathway and the place of action of statins