
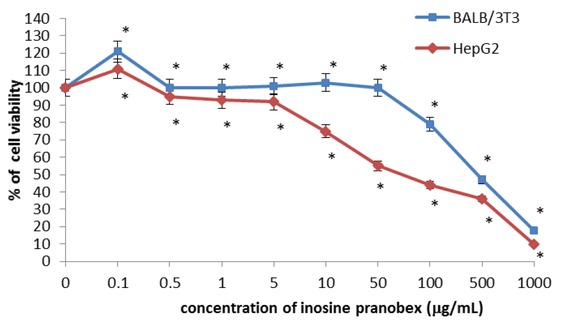
Fig. 1
Cytotoxicity of inosine pranobex in BALB/ 3T3 clone A31 and HepG2 lines detected with the MTT assay, n = 6. Values are given as percentage of cell viability relative to control cells. *P < 0.05, compared with control cells
Table 1
Cytotoxicity of inosine pranobex. Inhibitory concentration (IC50, μg/mL)
| BALB/ 3T3 clone A31 line | HepG2 line | |
|---|---|---|
| MTT reduction assay | 500 | 50 |
| LDH release assay | 100 | 10 |
| NRU assay | 500 | 100 |
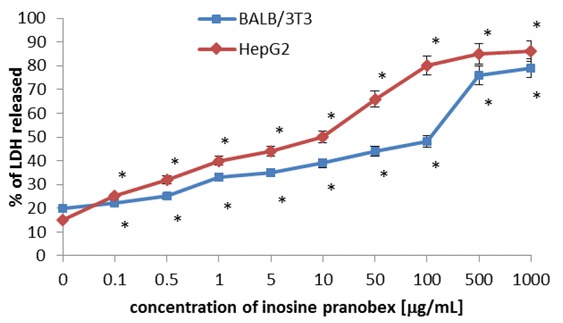
Fig. 2
Cytotoxicity of inosine pranobex in BALB/3T3 clone A31 and HepG2 lines detected with the LDH assay, n = 6. Values are given as percentage of LDH released. *P < 0.05, compared with control cells
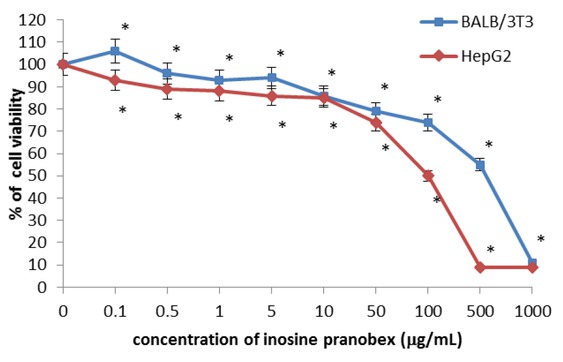
Fig. 3
Cytotoxicity of inosine pranobex in BALB/3T3 clone A31 and HepG2 lines detected with the NRU assay, n = 6. Values are given as percentage of cell viability relative to control cells. *P < 0.05, compared with control cells