
Fig. 1
Frequency of occurrence of the main foot lesions diagnosed (n = 75; 25 per MS group)
| Claw lesions diagnosed | MS 1 (%) | MS 2 (%) | MS 3 (%) | Total (%) |
|---|---|---|---|---|
| Infectious lesion Digital dermatitis | 0 | 0 | 3.3 | 3.3 |
| Heel erosion | 2.2 | 2.2 | 0 | 4.4 |
| Interdigital dermatitis | 1.1 | 0 | 3.3 | 4.4 |
| Non-infectious lesion | ||||
| Abscess | 4.4 | 1.1 | 6.7 | 12.2 |
| Double sole | 4.4 | 2.2 | 1.1 | 7.8 |
| Heel inflammation | 3.3 | 0 | 1.1 | 4.4 |
| Interdigital callus | 0 | 0 | 2.2 | 2.2 |
| Overgrowth | 1.1 | 1.1 | 0 | 2.2 |
| Sole haemorrhage | 4.4 | 12.2 | 2.2 | 18.9 |
| Ulcer | 2.2 | 3.3 | 7.8 | 13.3 |
| White line disease | 10 | 11.1 | 5.6 | 26.7 |
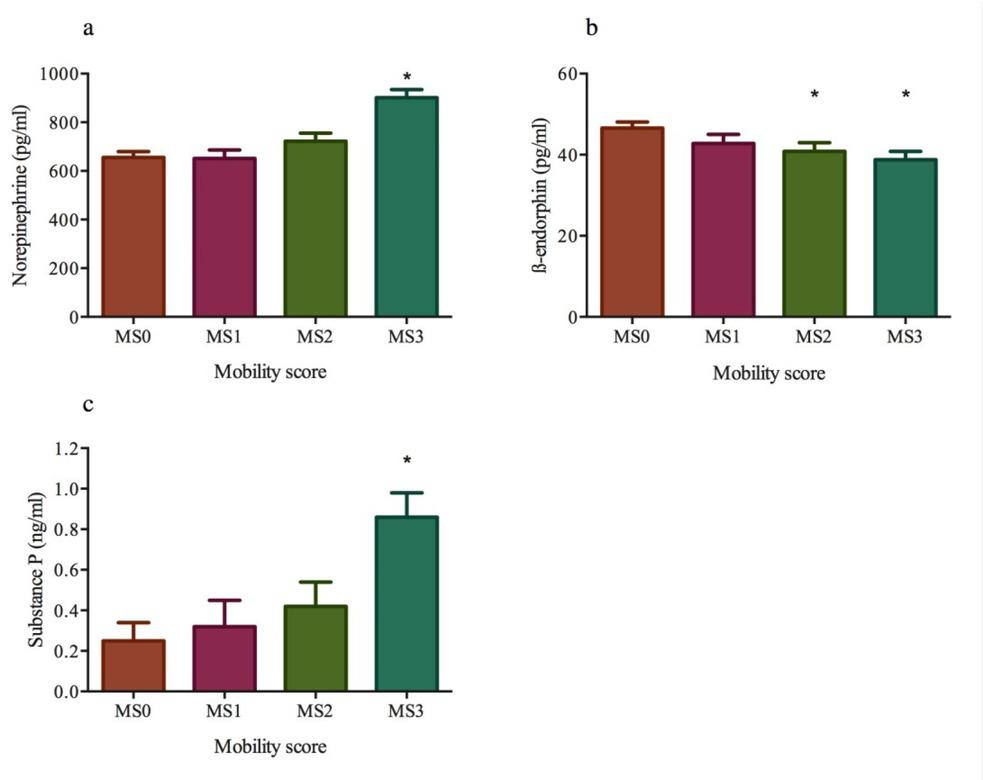
Linear mixed effect model of mobility scoring (MS) on norepinephrine, β-endorphin, and substance P plasma concentrations in lame and control dairy cows (N = 25 per MS)
| Variable | Estimated | Std. Error | 95% CI |
|---|---|---|---|
| Norepinephrine | |||
| MS0 | 655.83 | 24.09 | 607.83 – 703.83 |
| MS1 | −4.86 | 35.54 | −75.67 – 65.94 |
| MS2 | 65.85 | 34.07 | −2.03 – 133.72 |
| MS3 | 245.45 | 33.66 | 178.39 – 312.51 |
| β-endorphin | |||
| MS0 | 46.6 | 1.49 | 43.61 – 49.57 |
| MS1 | −3.8 | 2.2 | −8.20 – 0.59 |
| MS2 | −5.75 | 2.11 | −9.96 – −1.54 |
| MS3 | −7.84 | 2.09 | −11.0 – −3.68 |
| Substance P | |||
| MS0 | 0.25 | 0.09 | 0.08 – 0.43 |
| MS1 | 0.07 | 0.13 | −0.19 – 0.33 |
| MS2 | 0.17 | 0.12 | −0.08 – 0.41 |
| MS3 | 0.61 | 0.12 | 0.37 – 0.86 |