
Fig. 1
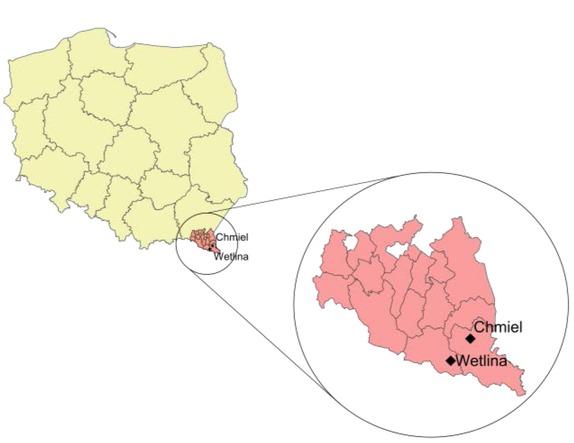
Fig. 2
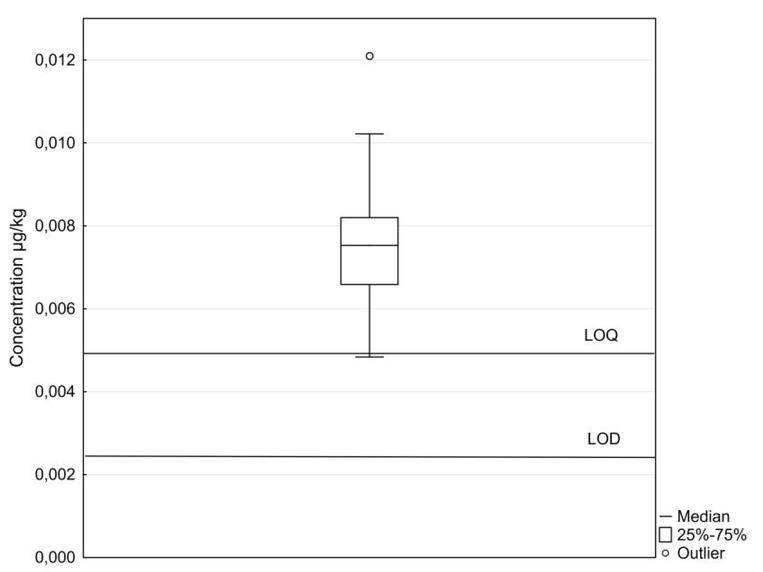
Individual concentrations of Enniatin B (μg/kg) detected in two tested flocks
| Flock 1 | Flock 2 | |
|---|---|---|
| Sample 1 | 0.0085 | - not detected above the limit of detection (LOD) |
| Sample 2 | 0.0074 | 0.0095 |
| Sample 3 | 0.0079 | 0.0063 |
| Sample 4 | 0.0082 | 0.0055 |
| Sample 5 | 0.0067 | 0.0058 |
| Sample 6 | 0.0075 | - not detected above the limit of detection (LOD) |
| Sample 7 | 0.0085 | 0.0102 |
| Sample 8 | 0.0074 | < LOQ detected between the LOD and level of quantification (LOQ) |
| Sample 9 | 0.0078 | 0.0066 |
| Sample 10 | 0.0077 | 0.0121 |
Method performance characteristics (n = 3) and detected concentrations of Enniatin B_ Results were corrected for the recoveries
| Analyte | Fortification | Apparent recovery | LOD | LOQ | Concentrations detected (μg/kg) | ||
|---|---|---|---|---|---|---|---|
| level ( μg/kg) | (%)(RSD) | ( μg/kg) | ( μg/kg) | Min | Max | Average | |
| Aflatoxin M1 | 0.05 | 86.2 (9.9) Extraction efficiency RE (%) | 0.0044 | 0.0088 | - | - | - |
| Enniatin B | 0.1545 | 74.4 (3.3) | 0.0025 | 0.0049 | 0.0055 | 0.0121 | 0.0078 |