
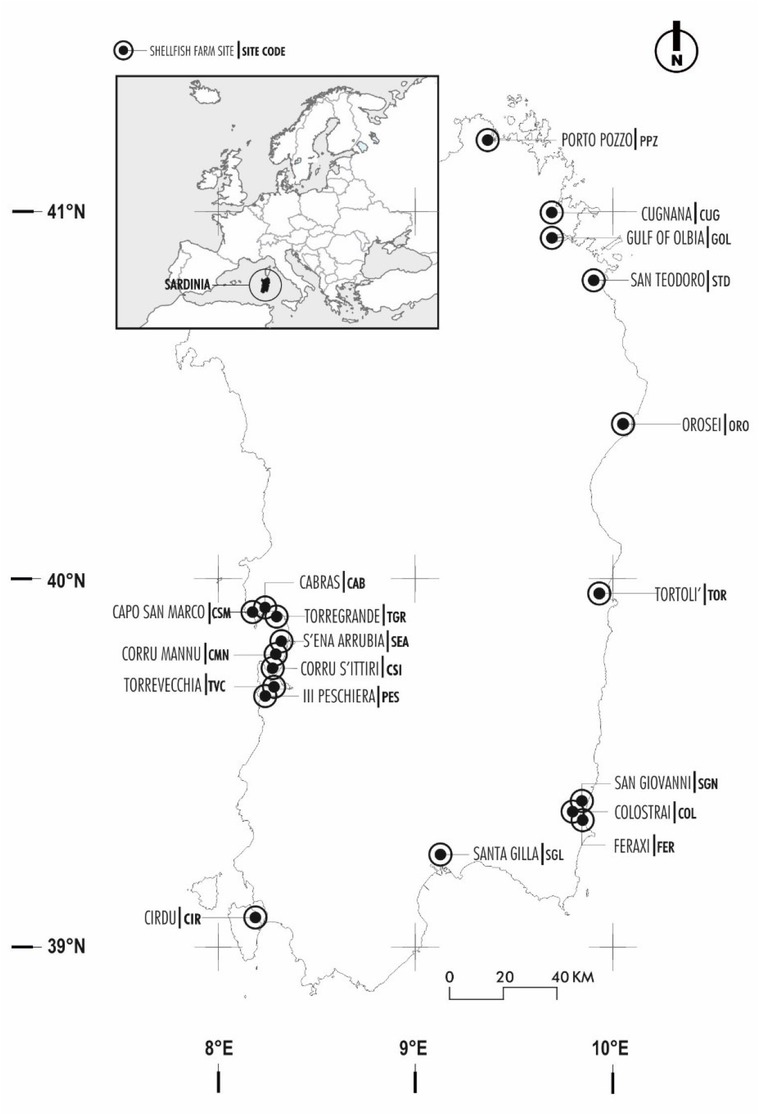
Fig. 1
Geographic locations of Sardinia and shellfish farm sampling sites (black circles)
Table 1
Abundance of Dinophysis acuminata and D. sacculus and quantification of okadaic acid toxin group among positive cases of diarrhoetic shellfish poisoning toxicity in 2015 and 2016
| Sampling date | Site Code-station | Abundance | (cell/L) | Okadaic acid toxin group | Shellfish products |
|---|---|---|---|---|---|
| D. acuminata | D. sacculus | (mg AO eq/Kg e.p.) | |||
| 23/05/2016 | CIR-1 | 0 | 0 | 675.8 | Mytilus galloprovincialis |
| 19/02/2015 | COL-1 | 0 | 0 | 341.3 | Mytilus galloprovincialis |
| 09/03/2015 | COL-1 | 0 | 0 | 470.4 | Mytilus galloprovincialis |
| 03/02/2015 | FER-1 | 0 | 0 | 1,269 | Mytilus galloprovincialis |
| 10/02/2015 | FER-1 | 0 | 0 | 263.1 | Mytilus galloprovincialis |
| 19/02/2015 | FER-1 | 0 | 0 | 516.2 | Mytilus galloprovincialis |
| 23/02/2015 | FER-1 | 0 | 0 | 738.9 | Mytilus galloprovincialis |
| 26/02/2015 | FER-1 | 0 | 0 | 317 | Mytilus galloprovincialis |
| 09/03/2015 | FER-1 | 0 | 0 | 424.5 | Mytilus galloprovincialis |
| 19/03/2015 | FER-1 | 0 | 0 | 383.1 | Mytilus galloprovincialis |
| 23/03/2015 | FER-1 | 0 | 0 | 257.2 | Mytilus galloprovincialis |
| 07/01/2016 | FER-1 | 1,040 | 120 | 355.8 | Mytilus galloprovincialis |
| 12/01/2016 | FER-1 | 1,720 | 40 | 1,111 | Mytilus galloprovincialis |
| 19/01/2016 | FER-1 | 0 | 0 | 790 | Mytilus galloprovincialis |
| 02/02/2016 | FER-1 | 40 | 0 | 547 | Mytilus galloprovincialis |
| 09/02/2016 | FER-1 | 40 | 0 | 778 | Mytilus galloprovincialis |
| 16/02/2016 | FER-1 | 0 | 0 | 315 | Mytilus galloprovincialis |
| 19/02/2016 | FER-1 | n.s | n.s | 273 | Mytilus galloprovincialis |
| 23/02/2016 | FER-1 | 40 | 0 | 385 | Mytilus galloprovincialis |
| 03/03/2016 | FER-1 | 0 | 0 | 317 | Mytilus galloprovincialis |
| 12/01/2016 | FER-2 | 0 | 0 | 660 | Tapes decussatus |
| 27/04/2015 | ORO- 1 | 1,560 | 0 | 184 | Mytilus galloprovincialis |
| 27/04/2015 | ORO-4 | 1,680 | 0 | 205 | Mytilus galloprovincialis |
| 15/06/2016 | ORO-4 | 40,200 | 9,400 | 607 | Mytilus galloprovincialis |
| 29/06/2016 | ORO-6 | 18,700 | 2,200 | 1,066 | Mytilus galloprovincialis |
| 04/07/2016 | ORO-6 | 2,200 | 400 | 371 | Mytilus galloprovincialis |
| 18/07/2016 | ORO-6 | n.s | n.s | 299 | Mytilus galloprovincialis |
| 25/07/2016 | ORO-6 | n.s | n.s | 188 | Mytilus galloprovincialis |
| 03/02/2015 | SGL-2 | 0 | 0 | 1480 | Mytilus galloprovincialis |
| 19/02/2015 | SGL-2 | 0 | 0 | 704.8 | Mytilus galloprovincialis |
| 19/02/2015 | SGL-3 | 0 | 0 | 498.8 | Mytilus galloprovincialis |
| 23/02/2015 | SGN-4 | 0 | 0 | 618.9 | Mytilus galloprovincialis |
| 12/01/2016 | STD-4 | 120 | 0 | 168 | Crassostrea gigas |
| 11/02/2015 | TOR-2 | 1,800 | 0 | 192.5 | Mytilus galloprovincialis |
| 11/02/2015 | TOR-3 | 142,662 | 37,895 | 1092 | Mytilus galloprovincialis |
| 26/02/2015 | TOR-3 | 14,400 | 400 | 188.2 | Mytilus galloprovincialis |
| 11/03/2015 | TOR-3 | 2,400 | 0 | 301.3 | Mytilus galloprovincialis |
| 18/03/2015 | TOR-3 | n.s | n.s | 326.5 | Mytilus galloprovincialis |
| 23/03/2015 | TOR-3 | n.s | n.s | 181.7 | Mytilus galloprovincialis |
| 15/04/2015 | TOR-3 | 9,400 | 0 | 210.2 | Mytilus galloprovincialis |
| 07/03/2016 | TOR-1 | n.s | n.s | 208 | Mytilus galloprovincialis |
| 14/03/2016 | TOR-1 | 200 | 0 | 204 | Mytilus galloprovincialis |
| 07/03/2016 | TOR-2 | n.s | n.s | 277 | Mytilus galloprovincialis |
| 14/03/2016 | TOR-2 | 600 | 0 | 299 | Mytilus galloprovincialis |
| 07/03/2016 | TOR-3 | n.s | n.s | 190 | Mytilus galloprovincialis |
| 14/03/2016 | TOR-3 | 400 | 0 | 200 | Mytilus galloprovincialis |
[i] n.s.: not sampled
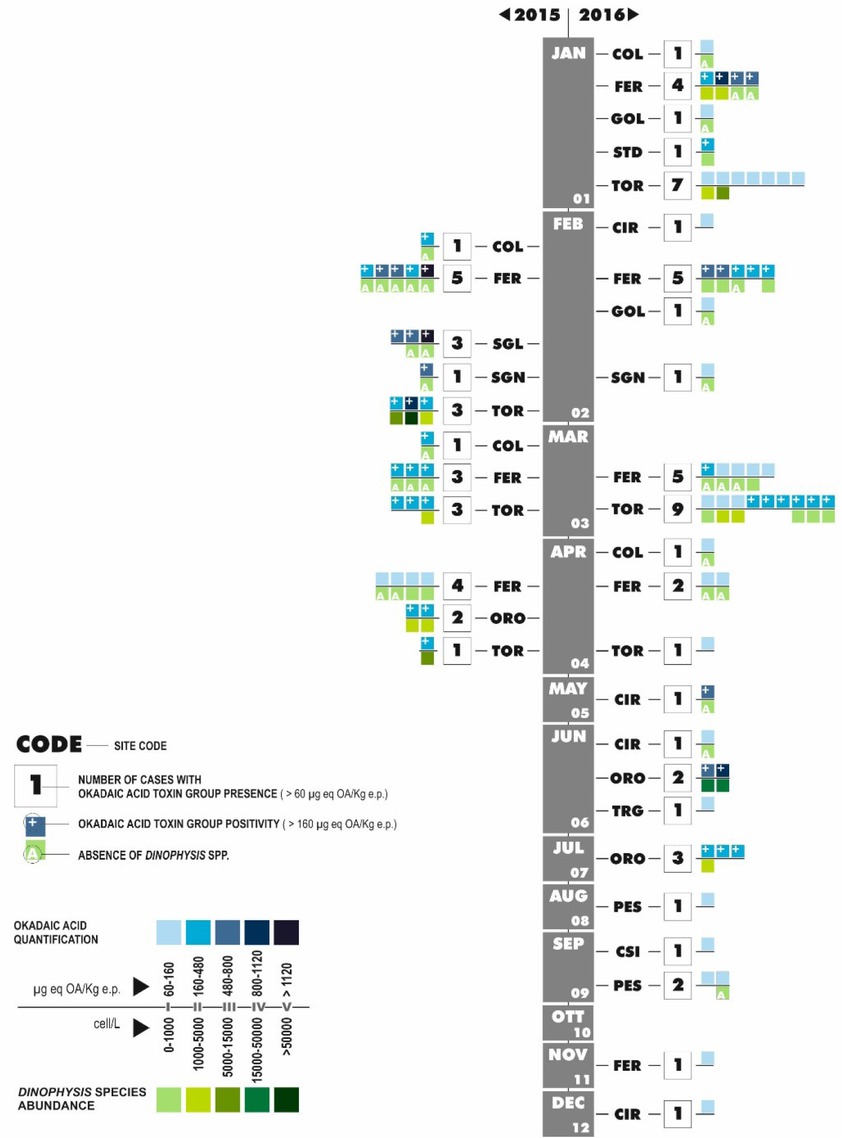
Fig. 2
Monthly numbers of cases (within the bigger squares) with okadaic acid toxin group in shellfish farms (identified with own site codes) during 2015 (left) and 2016 (right). Classes of okadaic acid toxin group quantification (smaller squares above the line) and Dinophysis spp. abundance (smaller squares below the line) are shown. Plus sign indicates values exceeding the legal limit for okadaic acid toxin group concentration. Letter A indicates the absence of Dinophysis spp.
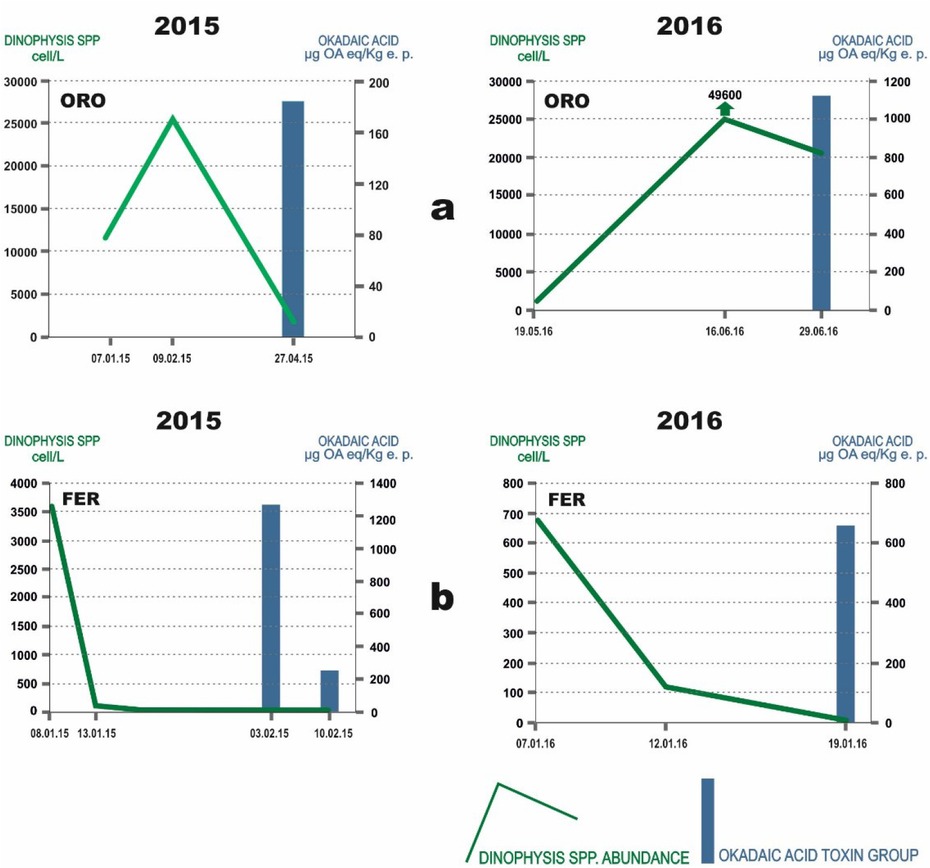
Fig. 3
Examples of the relationship between Dinophysis spp. cell abundance (green line) in seawater and the presence of okadaic acid toxin group (blue bar) in shellfish during 2015 (left side of figure) and 2016 (right side). The X-axis lists the dates of seawater and shellfish sampling; the left-hand Y-axis shows the values of Dinophysis species abundance (cell/L) and the right-hand Y-axis shows the okadaic acid toxin group concentration (μg OA eq/kg e.p.). a – increase in okadaic acid toxin group concentration concomitant with a decrease in Dinophysis spp. cell abundance in Orosei (ORO); b – presence of okadaic acid toxin group concomitant with Dinophysis spp. absence in Feraxi (FER)