Fig. 1a
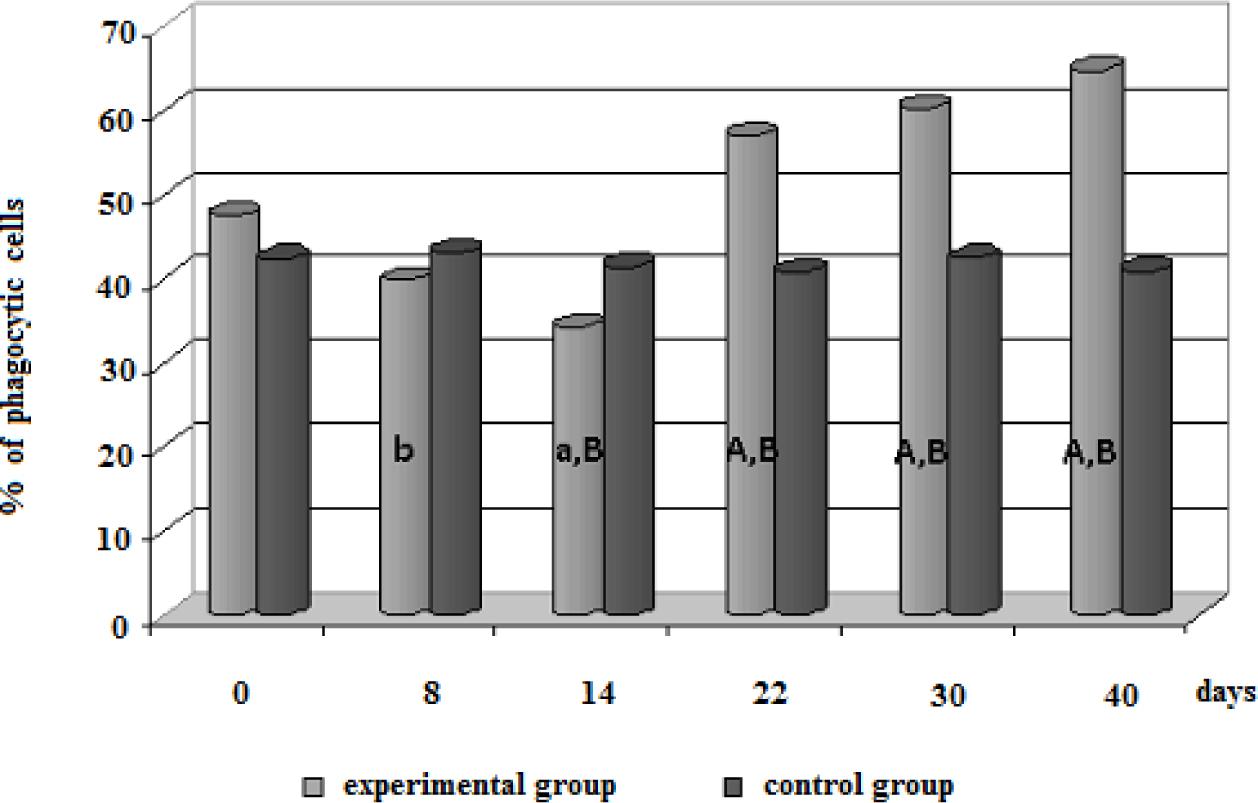
Fig. 1b
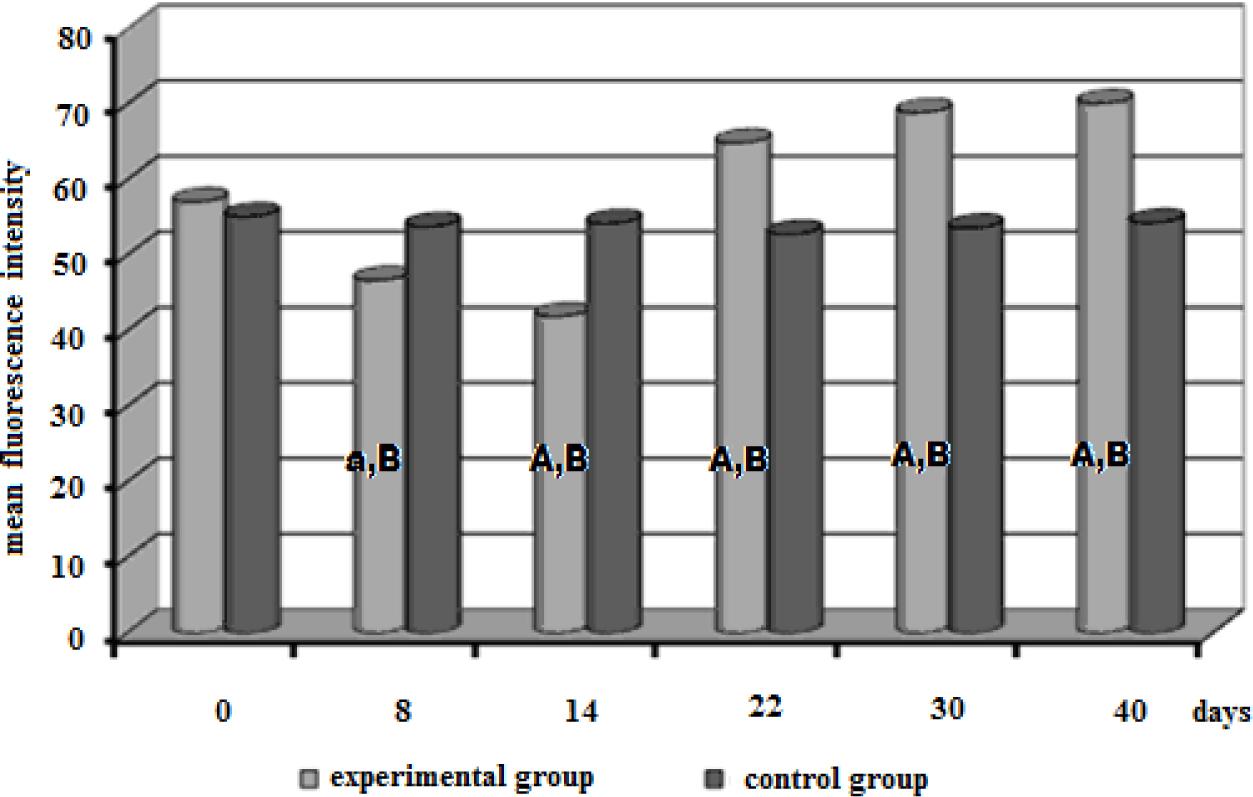
Fig. 2a
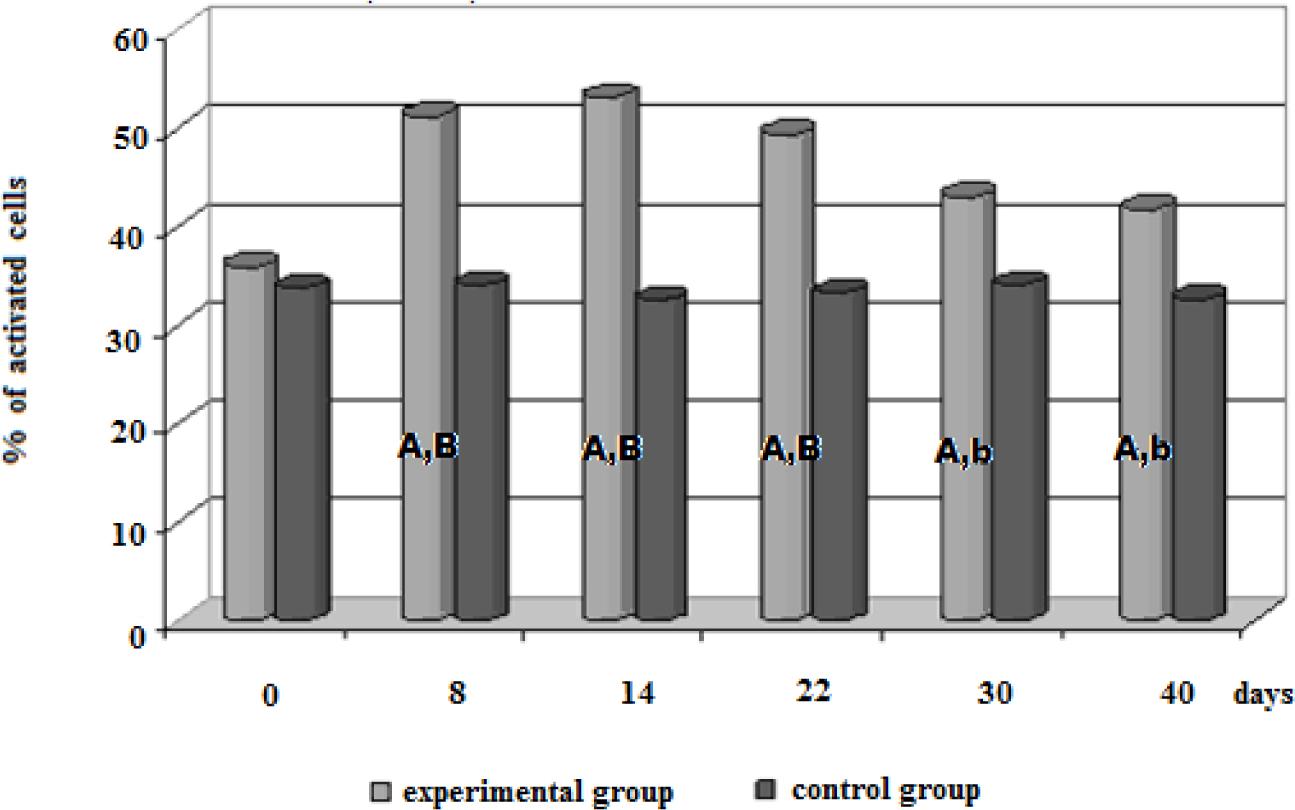
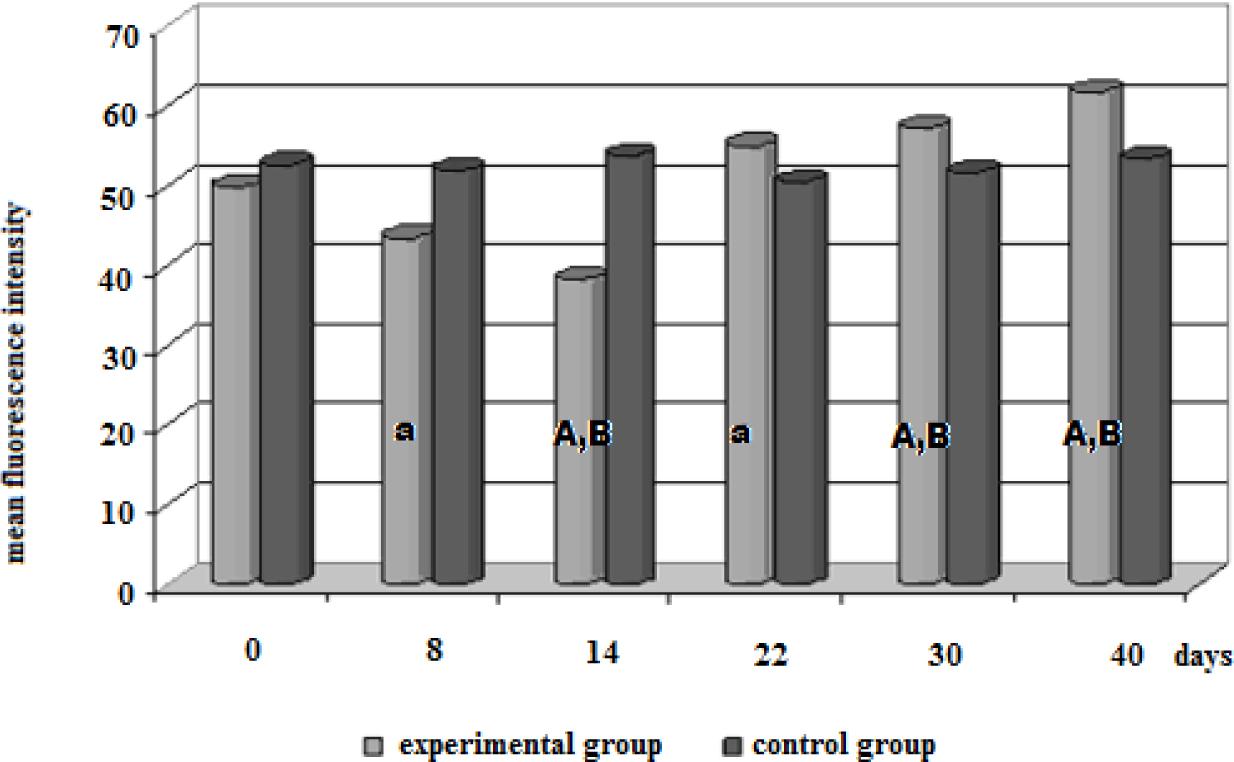
Fig. 2b

© 2018 Katarzyna Wojcicka-Lorenowicz, Krzysztof Kostro, Urszula Lisiecka, Bolesław Gąsiorek, published by National Veterinary Research Institute in Pulawy
This work is licensed under the Creative Commons Attribution-NonCommercial-NoDerivatives 3.0 License.