
Fig. 1
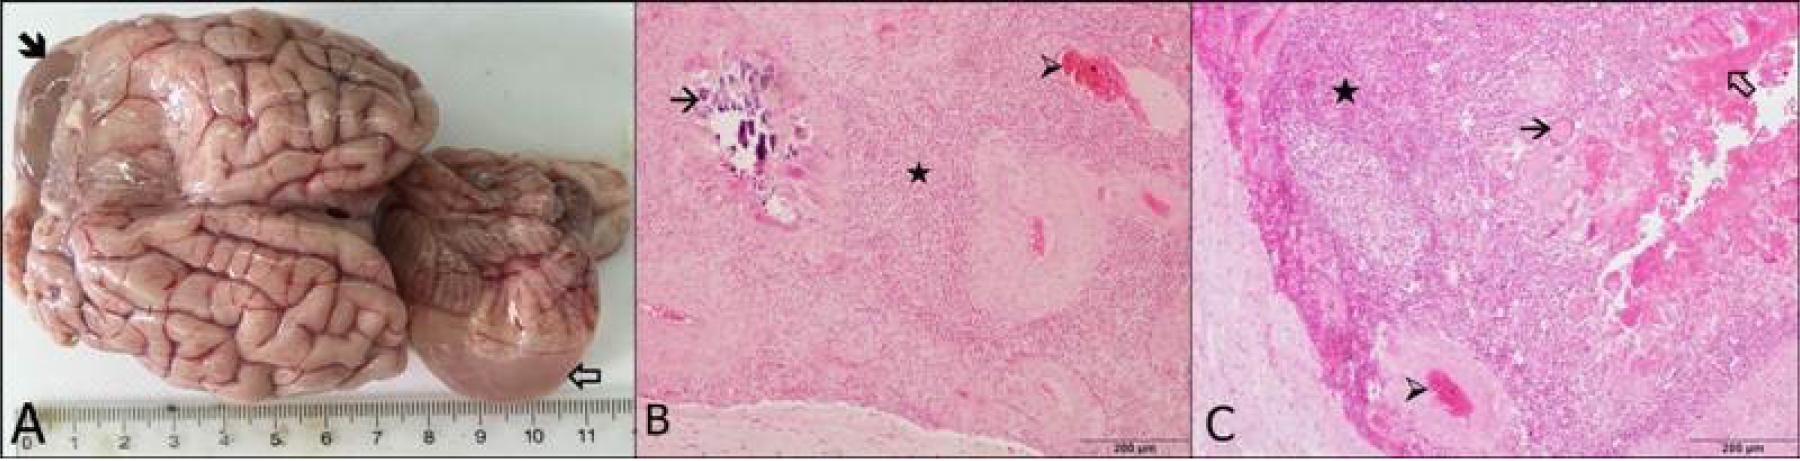
Fig. 2
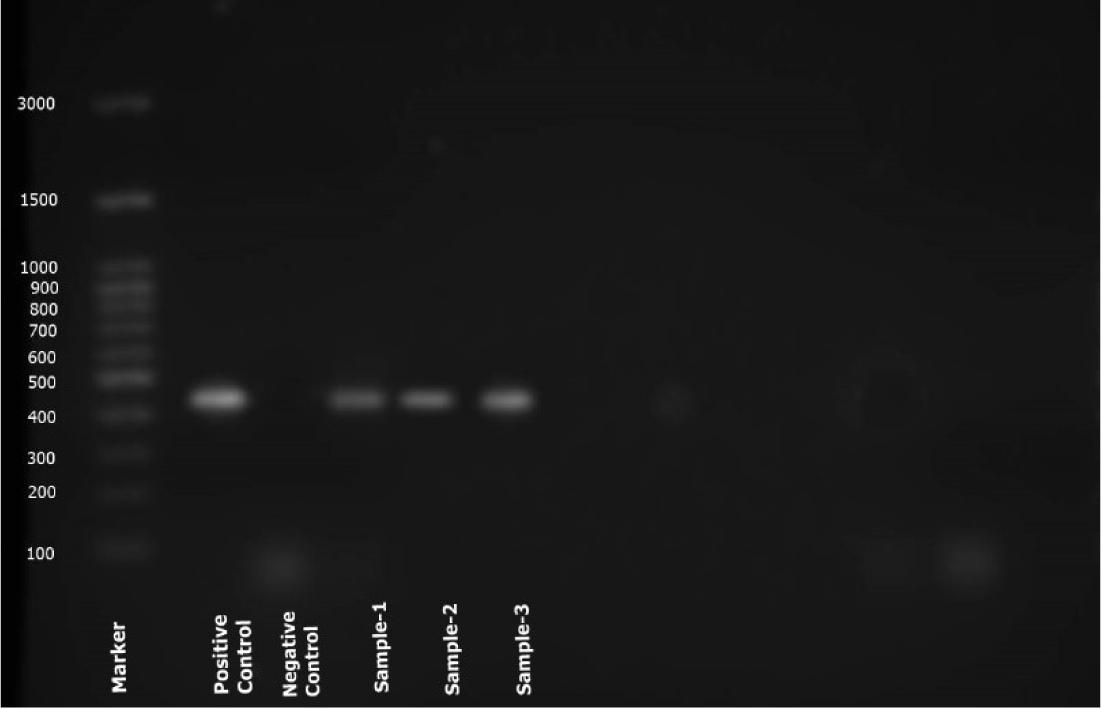
Fig. 3
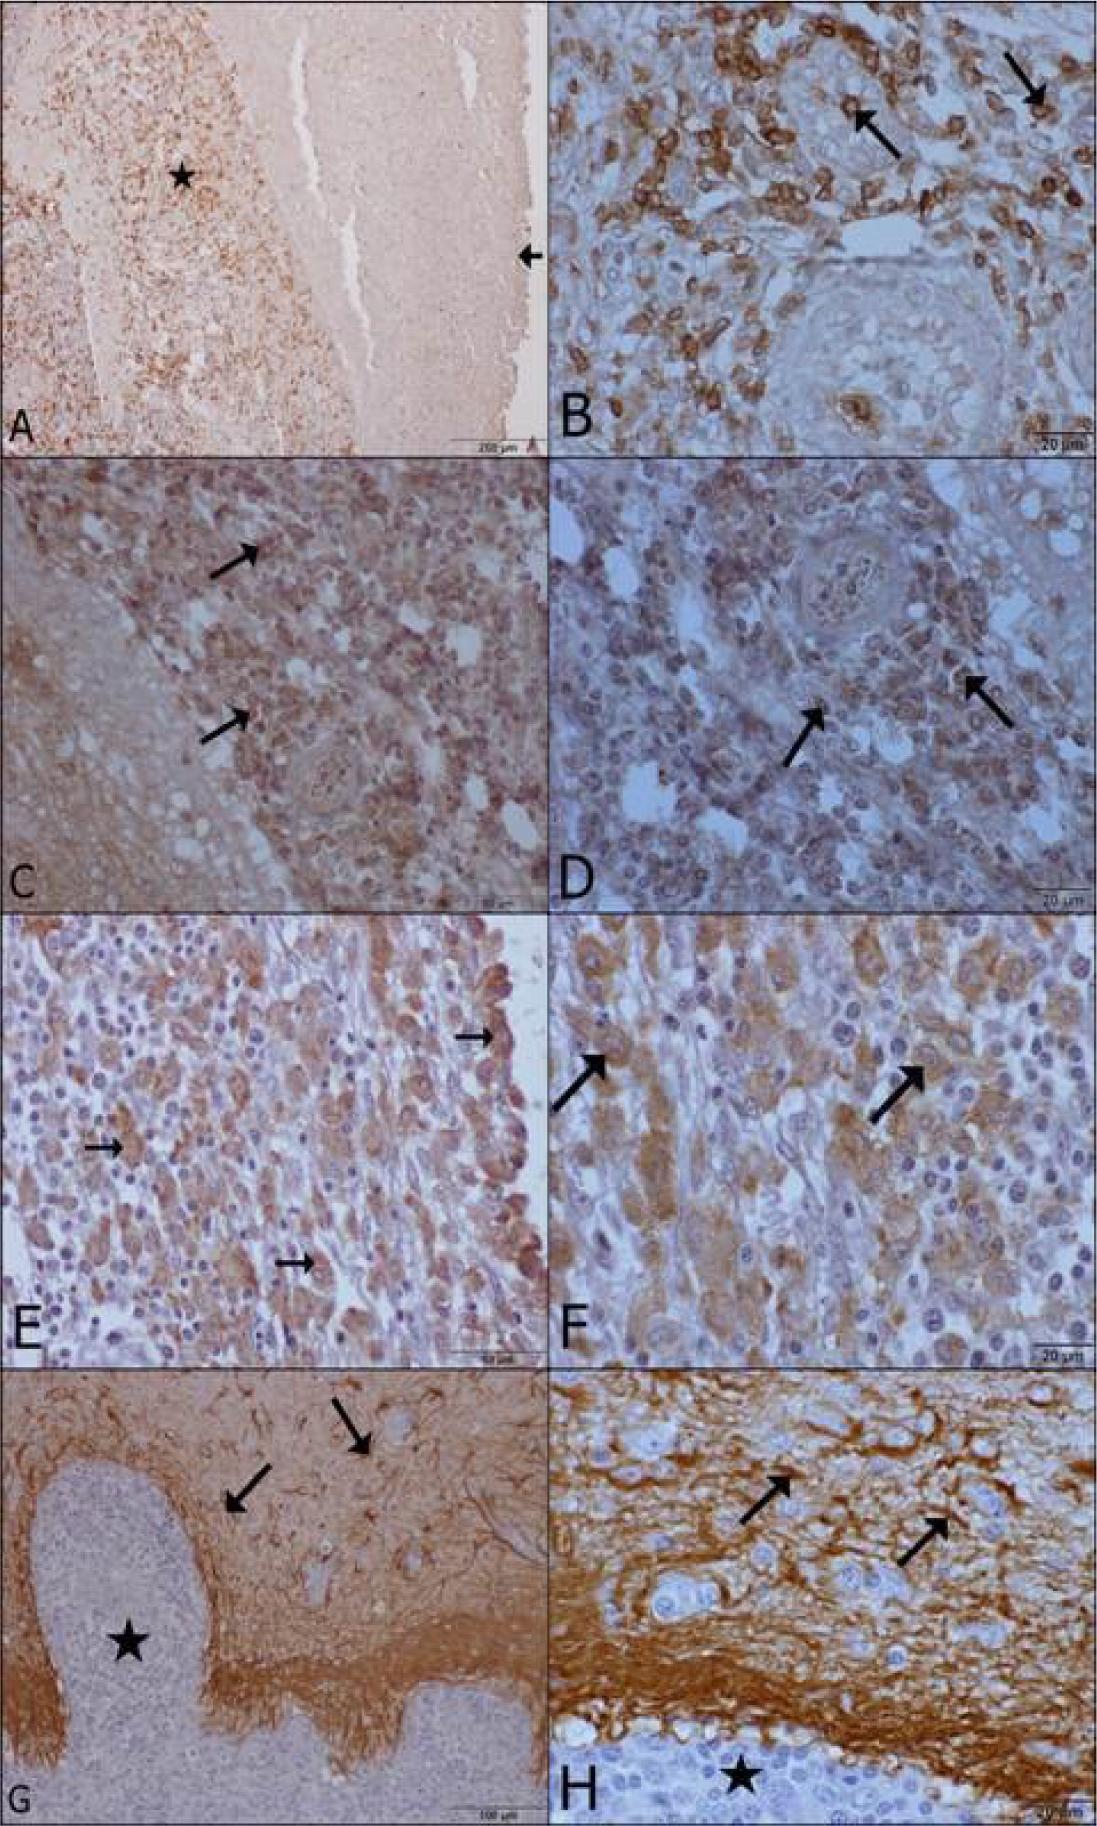
Difference between positive stained cell numbers using different antibodies
| Antibody | X ±SE | Min | Max |
|---|---|---|---|
| CD3 | 31.68 ± 2.362a | 22.6 | 51.2 |
| CD79 | 18.627 ± 0.705b | 13.4 | 24.2 |
| CD163 | 57.147 ± 3.68c | 30.4 | 80.0 |
| GFAP | 85.347 ± 0.609d | 80.0 | 89.0 |
| P < 0.001 | |||
Correlation between positive stained cell numbers using different antibodies
| Antibody | CD3 | CD79 | CD163 |
|---|---|---|---|
| CD3 | |||
| CD79 | 0.351 | ||
| CD163 | –0.218 | –0.059 | |
| GFAP | 0.0214 | –0.024 | 0.14 |
Cyst location and scolex numbers
| No | Sex | Age | Cyst location | Size of cyst | Scolex number |
|---|---|---|---|---|---|
| 1 | Male | 1 year | Left parietal lobe | 6×5 cm | 53 |
| Right parietal lobe | 5×4 cm | 47 | |||
| 2 | Female | 6 months | Left parietal lobe | 4×3 cm | 38 |
| Right parietal lobe | 4×3 cm | 36 | |||
| 3 | Male | 9 months | Left frontal lobe | 5×4.5 cm | 49 |
| Right frontal lobe | 3×2 cm | 26 | |||
| Right parietal lobe | 3×2 cm | 29 | |||
| 4 | Female | 2 years | Left parietal lobe | 6×5 cm | 55 |
| Right parietal lobe | 5×4 cm | 45 | |||
| 5 | Male | 6 months | Right parietal lobe | 3×2.5 cm | 32 |
| Right temporal lobe | 3×2 cm | 24 | |||
| Left frontal lobe | 3×2 cm | 25 | |||
| Left parietal lobe | 3×2 cm | 28 | |||
| 6 | Male | 1 year | Left frontal lobe | 5×4.5 cm | 38 |
| Right frontal lobe | 5×5 cm | 48 | |||
| 7 | Female | 1 year | Left frontal lobe | 6×5 cm | 53 |
| Right frontal lobe | 4×5 cm | 50 | |||
| 8 | Female | 4 years | Left frontal lobe | 4×3 | 32 |
| Right frontal lobe | 4×3 | 30 | |||
| 9 | Male | 6 months | Left frontal lobe | 3×3 | 28 |
| Right frontal lobe | 3×3 | 26 | |||
| Left parietal lobe | 2×2.5 | 21 | |||
| Right parietal lobe | 2×2.5 | 24 | |||
| 10 | Male | 8 months | Left temporal lobe | 4×3 | 36 |
| 11 | Male | 6 months | Left temporal lobe | 3×3 | 33 |
| Right temporal lobe | 3×2 | 21 | |||
| 12 | Female | 2.5 years | Left occipital lobe | 3×3 | 33 |
| Right occipital lobe | 3×2 | 25 | |||
| 13 | Male | 7 months | Right frontal lobe | 3×3.5 cm | 38 |
| Cerebellum | 2×2 cm | 30 | |||
| 14 | Male | 7 months | Cerebellum | 3×2 cm | 30 |
| 15 | Female | 1 year | Left frontal lobe | 5×6 cm | 47 |
| Right frontal lobe | 4×3 cm | 35 | |||
Differences in immunohistochemical staining protocol
| CD3 | CD79α | CD163 | GFAP | |
|---|---|---|---|---|
| Antigen retrieval | 20 min, 120°C, 1 atm, autoclave, citrate buffer | 20 min, 120°C, 1 atm, autoclave, citrate buffer | 10 min, 800 watt, microwave, citrate buffer | 15 min, room temperature, microwave, proteinase K |
| H2O2 | 30 min | 25 min | 30 min | 15 min |
| Primer antibody application, time and temperature | 1 h, room temperature | 1 h, room temperature | 30 min, room temperature | 1 h, 37°C |
| 3,3’-diaminobenzidine tetrahydrochloride (DAB) | 10 min | 10 min | 7 min | 3 min |